by Paul Gilster | Sep 17, 2021 | Deep Sky Astronomy & Telescopes |
White dwarfs have turned out to be more interesting than I had imagined. We know how they form: A star like the Sun exhausts the hydrogen in its core and swells into a red giant, a scenario that is a trope in science fiction, as it posits an Earth of the far-future incinerated by its star. Losing its outer layers near the end of nuclear burning, a red giant ultimately leaves behind an object with much of the mass of the Sun now crammed into a white dwarf that is about the size of the Earth. For years I assumed white dwarfs were dead ends, a terminus for life whose only function seemed to be in binary systems, where they could be the locus, through accretion from the other star, of a stellar explosion in the form of a nova.
Lately we’ve been learning, though, that through analysis of their atmospheres, white dwarfs can yield information about objects that have fallen into them, such as remnants of the original stellar system. Some white dwarfs may have habitable zones lasting several billion years, an interesting thought if surviving planets in the system migrate inward. And now, thanks to Hubble data, we are learning that white dwarfs may have a longer lifetime than previously thought. Continuing to burn hydrogen, some of these stars may be older than they look.
The work was coordinated by Francesco Ferraro (Alma Mater Studiorum Università di Bologna / Italian National Institute for Astrophysics), who points to the useful role of white dwarfs in determining the ages of stars. The white dwarf cooling rate has been used as a natural clock as a way of calibrating the age of star clusters, as their cooling seemed easy to model by following the relationship between age and temperature. But the new study finds that white dwarf aging is nowhere near as simple as this, so an accepted method of measuring cluster ages may have to be re-examined.
To investigate white dwarf aging, the scientists looked at the globular clusters M3 in the constellation Canes Venatici and M13 in Hercules, in which stars in aggregate show common values of metallicity and age. As always in astronomy, the word ‘metals’ refers to elements higher than hydrogen and helium, with the bulk of a star like the Sun being made up of the latter two, while a scant 1.3 percent is given over to metals.
Ferraro’s team compared cooling white dwarfs in the two clusters and found that among the stars that will eventually become white dwarfs, the color of stars in the Horizontal Branch is bluer in M13 than in M3. The Horizontal Branch is a stage in the evolution of a star in which it has begun helium burning in the core, a stage that is flagged by a reduction in luminosity and increases in surface temperature. So the enhanced blue color in M13 is indicative of hotter stars on their way toward white dwarf status.
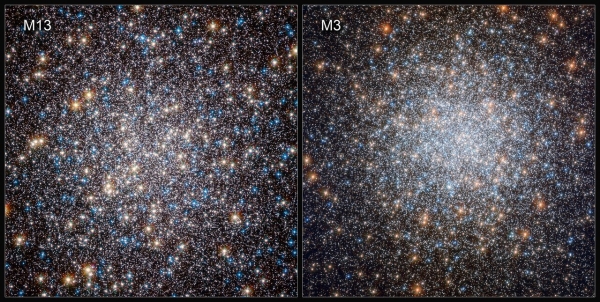
Image: To investigate the physics underpinning white dwarf evolution, astronomers compared cooling white dwarfs in two massive collections of stars: the globular clusters M3 and M13. These two clusters share many physical properties such as age and metallicity, but the populations of stars which will eventually give rise to white dwarfs are different. This makes M3 and M13 together a perfect natural laboratory in which to test how different populations of white dwarfs cool. Credit: ESA/Hubble & NASA, G. Piotto et al.
The researchers consider the M3 and M13 clusters to be “a classical horizontal branch (HB) morphology pair” because they share many physical properties including metallicity, making the color difference the salient feature. Homing in on the white dwarfs among this population, the team finds the outer envelope of hydrogen in these bluer white dwarfs allows them to burn for longer and cool more slowly than the standard white dwarf model. Using near-ultraviolet data from Hubble’s Wide Field Camera 3, the team compared more than 700 white dwarfs in the two clusters.
The result: M3’s white dwarfs follow the expected model, consisting of predictably cooling stellar cores and no stable thermonuclear activity. But in M13, two populations of white dwarfs can be found, the second being those that have retained an outer hydrogen envelope, continue thermonuclear burning and therefore cool at a slower pace. In fact, 70 percent of the white dwarfs in M13 appear to be burning hydrogen on their surface. This appears to be the only viable explanation for the ‘blue tail’ found in the Hubble data that distinguishes the two clusters.
From the paper:
At the moment, this [hydrogen burning on the surface] appears to be the most viable and natural explanation, while alternative scenarios should invoke ad hoc and unknown mechanisms able to increase the production or slow down the cooling process of the WDs in M13, and not in M3. The discovery reported in this paper represents the first direct evidence for the occurrence of stable nuclear burning in the residual hydrogen envelope of cooling WDs and offers an empirical measure of the delay in the flow of time marked by the WD clock in the presence of slowly cooling WDs.
The authors believe the road ahead should involve studying other clusters that show differences when at the Horizontal Branch of stellar evolution, while also examining clusters with different degrees of metallicity to determine the role it plays. Clarifying how white dwarfs evolve will force us to adjust the use of these stellar remnants in calibrating age, where current uncertainties can be as large as a billion years.
Adds Ferraro:
“Our discovery challenges the definition of white dwarfs as we consider a new perspective on the way in which stars get old. We are now investigating other clusters similar to M13 to further constrain the conditions which drive stars to maintain the thin hydrogen envelope which allows them to age slowly.”
The paper is Chen et al., “Slowly cooling white dwarfs in M13 from stable hydrogen Burning,” Nature Astronomy 6 September 2021 (abstract).

by Paul Gilster | Sep 16, 2021 | Deep Sky Astronomy & Telescopes |
Here’s a story that’s both mind-bending and light-bending. It involves a supernova that, on the one hand, happened 10 billion years ago, and on the other hand, has appeared in our skies not once but three times, with a fourth in the works. In play here is gravitational lensing, in which light from a background galaxy bends around a foreground galactic cluster known as MACS J0138.0-2155. Out of this we get multiple mirror images, and researchers predict another supernova appearance in the year 2037.
Three of the appearances of the supernova, labeled AT 2016jka and nicknamed ‘Requiem,’ are in the image below, a Hubble view from 2016, all three circled for ease of identification. The light of the supernova has been split into different images by the lensing effect. Using archival data, researchers led by Steve Rodney (University of South Carolina) have analyzed differences in brightness and color that reflect different phases of the event as the supernova faded.
“This new discovery is the third example of a multiply imaged supernova for which we can actually measure the delay in arrival times,” says Rodney. “It is the most distant of the three, and the predicted delay is extraordinarily long. We will be able to come back and see the final arrival, which we predict will be in 2037, plus or minus a couple of years.”
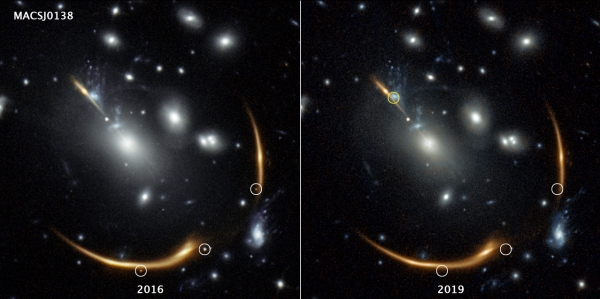
Image: Three views of the same supernova appear in the 2016 image on the left, taken by the Hubble Space Telescope. But they’re gone in the 2019 image. The distant supernova, named Requiem, is embedded in the giant galaxy cluster MACS J0138. The cluster is so massive that its powerful gravity bends and magnifies the light from the supernova, located in a galaxy far behind it. Called gravitational lensing, this phenomenon also splits the supernova’s light into multiple mirror images, highlighted by the white circles in the 2016 image. The multiply imaged supernova disappears in the 2019 image of the same cluster, at right. The snapshot, taken in 2019, helped astronomers confirm the object’s pedigree. Supernovae explode and fade away over time. Researchers predict that a rerun of the same supernova will make an appearance in 2037. The predicted location of that fourth image is highlighted by the yellow circle at top left. The images were taken in near-infrared light by Hubble’s Wide Field Camera 3. Image processing credit: Joseph DePasquale (STScI).
Cluster and supernova are at vastly different distances from us, with the light from the lensing cluster MACS J0138.0-2155 taking about four billion years to reach us, while the light from the supernova has traveled an estimated 10 billion years. Computer modeling makes the call on the supernova’s return appearance as researchers untangle the complex path followed by the light.
In fact, says Rodney, the longer delay in the predicted 2037 light is the result of its traveling through the middle of the cluster and thus encountering the densest amount of dark matter. While dark matter remains controversial in many ways, it’s telling that the assumption of dark matter in the cluster explains the current three images and makes the call on the upcoming fourth. There appears to be a likelihood for a fifth appearance some time after the 2037 event, although the prediction is that it will be extremely hard to detect.
The lensing supernova images were discovered by Gabe Brammer (Niels Bohr Institute, University of Copenhagen), who found the three mirrored images while analyzing lensing magnification effects for the REQUIEM (REsolved QUIEscent Magnified Galaxies ) program, which uses Hubble data. Comparing the 2019 data with data from three years earlier showed that what he thought was a single image of a lensed galaxy had disappeared. Says Brammer:
“But then, on further inspection of the 2016 data, I noticed there were actually three magnified objects, two red and a purple. Each of the three objects was paired with a lensed image of a distant massive galaxy. Immediately it suggested to me that it was not a distant galaxy but actually a transient source in this system that had faded from view in the 2019 images like a light bulb that had been flicked off.”
Co-author Johan Richard (University of Lyon) developed a map of the amount of dark matter in the foreground cluster that drew on inferences from the lensing effects found in Brammer’s data. The map fits with the locations of the lensed objects based on Richard’s assumptions. Analyzing the fourth image in 2037, assuming all happens as expected, will allow astronomers to more accurately measure the time delays between the four images, which in turn will yield further data on the distortions to spacetime through which the light transited. Adds Rodney:
“These long time delays are particularly valuable because you can get a good, precise measurement of that time delay if you are just patient and wait years, in this case more than a decade, for the final image to return. It is a completely independent path to calculate the universe’s expansion rate. The real value in the future will be using a larger sample of these to improve the precision.”
In the excerpt from the paper below, MRG-M0138 refers to the background galaxy containing the supernova, which is being lensed by the foreground galaxy cluster MACS J0138.0-2155:
We model the mass distribution in the cluster core as the combination of a cluster-scale and galaxy-scale potentials… From this model we derive estimates for the lensing magnification and time delay of each of the SN images, including two predicted future images… The lens model predicts that the SN should appear in the fourth MRG-M0138 image in the year 2037±2, demagnified with µ = 0.4 ± 0.2. A fifth image will also appear at a still later date, located near the center of the cluster and much more significantly demagnified, so it will not be easily observable. We anticipate that future lens modelling of the cluster will improve on these predictions primarily by exploring a wider range of mass models and incorporating more observational constraints.
The building of the model that makes the 2037 prediction is fascinating, fully explicated in the ‘Methods’ section of the paper, as the researchers use a software program called LENSTOOL to develop five lens models that would yield the lensing effects seen in the data. The best fit model was then used to predict the magnification and time delays for the three images observed by Hubble, as well as the location of the fourth and fifth images, which have yet to appear. An education on lens modeling is available here for those interested in digging into the details.
The name Requiem comes into use for a reason beyond the reference to the REQUIEM program. I like the note at the end of the paper that explains it:
HST observations enabled us to find this SN. We anticipate that HST may be deorbited and make its final plummet to Earth around the time of the reappearance of AT 2016jka, so we coin the name SN Requiem as an ode to the vast new discovery space that HST continues to unveil.
Nicely put.
The paper is Rodney et al., “A gravitationally lensed supernova with an observable two-decade time delay,” Nature Astronomy 13 September 2021 (abstract / preprint).
by Paul Gilster | Sep 1, 2021 | Deep Sky Astronomy & Telescopes |
The brown dwarf WISEA J153429.75-104303.3 — happily nicknamed ‘The Accident’ — is peculiar enough that it may point to a rare population of extremely old brown dwarfs. Dan Caselden, a citizen scientist who built an online program to filter data from the NEOWISE spacecraft, is able to highlight brown dwarfs moving through the NEOWISE field with his software, and while looking at one, he caught a glimpse of another. Call that a lucky catch, because the object didn’t match his program’s profile of a conventional brown dwarf.
We’ve found about 2,000 brown dwarfs thus far, many using data from WISE — Wide Field Infrared Survey Explorer — which was launched in 2009, placed into hibernation in 2011 after its primary mission ended, and then reactivated in 2013 as NEOWISE, a repurposed spacecraft given the new goal of tracking near-Earth objects. WISE 1534?1043 — the shortened name of the object, used by the authors of a new paper on it — stands out from all previously known brown dwarfs because it seems to have very little methane, unlike the brown dwarfs we’re familiar with, among which methane is common at WISE 1534?1043’s temperatures.
What we may be looking at is the signature of an extremely old, and cold, brown dwarf that emerged at a time when the galaxy was low enough in carbon that little methane could form in its atmosphere. That’s the thesis of the paper in Astrophysical Journal Letters, whose lead author is Davy Kirkpatrick (Caltech). The authors believe WISE 1534?1043 may be between 10 and 13 billion years old, making it double the median age of known brown dwarfs.
Adding punch to the hypothesis is the fact that, at about 50 light years from Earth, WISE 1534?1043 is moving much faster — well over 200 kilometers per second — than any other brown dwarf at a comparable distance. This may imply gravitational acceleration from encounters sustained in a long, long lifetime. If one such ancient brown dwarf is out there, we should find others.
Co-author Federico Marocco (Caltech) led the new observations of WISE 1534?1043, which extend earlier studies of the object, using the Keck and Hubble instruments:
“It’s not a surprise to find a brown dwarf this old, but it is a surprise to find one in our backyard. We expected that brown dwarfs this old exist, but we also expected them to be incredibly rare. The chance of finding one so close to the solar system could be a lucky coincidence, or it tells us that they’re more common than we thought.”
Image: This video shows data from NASA’s Near-Earth Object Wide-Field Infrared Survey Explorer (NEOWISE), launched in 2009 under the moniker WISE. The moving object in the bottom left corner is a brown dwarf officially named WISEA J153429.75-104303.3 and nicknamed “The Accident.” Credit: NASA/JPL-Caltech/Dan Caselden.
This unusual object is too faint at all wavelengths, the paper notes, for spectroscopy to be used at any current facility. Thus the interpretations given in the Kirkpatrick paper rely on trends found among other better known objects extended “into a terra incognita guided by theoretical predictions.” In addition to the idea that it is an extremely old brown dwarf with the low metallicity of its origins in a young galaxy, the authors examine other possibilities.
Are we actually dealing with an extremely low mass young brown dwarf? Evidently not, as the methane deficiency is hard to reconcile with this option. Could WISE 1534?1043 be an ejected exoplanet? Here we need atmospheric data, which we don’t have, to examine the elements therein, knowing that giant planets in our Solar System are more metal rich than the Sun (carbon is enhanced in Jupiter by three times the amount found in the Sun, and more so in Saturn, Uranus and Neptune). Thus we would have a marker, if we could find it. From the paper:
Under this hypothesis, WISE 1534?1043 is photometrically unusual because such elemental differences would profoundly affect its atmospheric composition and emergent spectrum. Unfortunately, forward modeling that incorporates a wide array of elemental abundance differences does not yet exist, so our best method to test this hypothesis is atmospheric retrieval, once a suitable spectrum for WISE 1534?1043 is obtained.
A final possibility is an ultracold stellar remnant, meaning a white dwarf, but this explanation falls short due to models showing a white dwarf could not have cooled to these temperatures within the lifetime of the Milky Way. Thus only one conclusion seems likely:
We conclude that the unique object WISE 1534?1043 is most likely a cold, very metal-poor brown dwarf—perhaps even the first Y-type subdwarf…
But note this:
Verification, refutation, or further befuddlement should be possible via additional photometry and broad-wavelength spectroscopy from the James Webb Space Telescope.
‘Further befuddlement’ indeed! An honest comment about an extremely unusual object.
The paper is Kirkpatrick et al., “The Enigmatic Brown Dwarf WISEA J153429.75-104303.3 (a.k.a. “The Accident”),” Astrophysical Journal Letters Vol. 915, No. 1 (30 June 2021), L6 (abstract / full text).

by Paul Gilster | Aug 20, 2021 | Deep Sky Astronomy & Telescopes |
Anomalies in our models are productive. Often they can be explained by errors in analysis or sometimes systematic issues with equipment. In any case, they force us to examine assumptions and suggest hypotheses to explain them, as in the case of the unusual acceleration of stars that has turned up in two areas. Greg Matloff has written about one of them in these pages, the so-called Parenago’s Discontinuity that flags an unusual fact about stellar motion: Cool stars, including the Sun, revolve around galactic center faster than hotter ones.
This shift in star velocities occurs around (B-V) = 0.62, which corresponds to late F- or early G-class stars and extends down to M-dwarfs. In other words, stars with (B-V) greater than 0.61 revolve faster. The (B-V) statement refers to a color index that is used to quantify the colors of stars using two filters. One, the blue (B) filter, lets only a narrow range of wavelengths centered on blue colors through, while the (V) visual filter only passes wavelengths close to the green-yellow band. Hot stars have (B-V) indices closer to 0 (or negative); cool M-dwarf stars come out closer to 2.0. Proxima Centauri’s (B-V) number, for example, is 1.90. The (B–V) index for the Sun is about 0.65.

What the Soviet space scientist Pavel Parenago (1906-1960) had observed is that cooler stars, at least in the Sun’s neighborhood, revolve about 20 kilometers per second faster around the galactic center than hotter, more massive stars. Work in the 1990s using Hipparcos data on over 5,000 nearby main sequence stars clearly showed the discontinuity. An early question was whether or not this was an effect local to the Sun, or one that would prove common throughout the galaxy.
Image: Soviet space scientist Pavel Parenago. Credit: Visuotin? Lietuvi?.
The answer came in the form of a paper by Veniamin Vityazev (St. Petersburg State University) and colleagues in 2018. The scientists hugely expanded the stars in their sample by using the Gaia Data Release 1 dataset,. The Gaia release included some 1,260,000 stars on the main sequence and a further 500,000 red giants. As we saw yesterday, the Gaia mission, which launched in 2013, is continuing to gather data at the Earth-Sun L2 Lagrange point, using astrometric methods to determine the positions and motions of a billion stars in the galaxy.
You may remember that the Vityazev paper (citation below) and its consequences was the subject of a 2019 dialogue in these pages between Greg Matloff and Alex Tolley (see Probing Parenago: A Dialogue on Stellar Discontinuity). And for good reason: The Gaia dataset allowed the Russian scientist and colleagues to demonstrate that Parenago’s Discontinuity was not a local phenomenon, but was indeed galactic in nature. All of this naturally leads to questions about the mechanisms at work here — Matloff’s interest in panpsychism as one explanation is well known and discussed in his book Starlight, Starbright (Curtis, 2019).
But in a new paper with Matloff, Roman Ya. Kezerashvili (New York City College of Technology) and Kelvin Long (Interstellar Research Centre, UK) point to another noteworthy datapoint. The extensive Gaia dataset showed a feature that turned up in the Hipparcos data as well. There was what the authors call a ‘strange bump in the curve of galactic revolution velocity versus (B-V) color index between (B-V) ? 0.55 and (B-V) ? 0.9…’ This would take in stars of the spectral classes G1 through K2, and the authors add that the bump is apparent only in the direction of stellar galactic revolution, like Parenago’s Discontinuity itself. Is this to be construed as a subset of the discontinuity or a separate effect? We don’t yet know.
What we do have is apparent acceleration in the direction that stars rotate around the galaxy, an unusual effect that adds up: In a billion years, the positional shift between a star without this acceleration vs. with the acceleration is about 1,500 light years.
This second apparent acceleration has yet to be confirmed by other researchers, as the authors acknowledge. But as we await that result, the new paper investigates the physical processes that could account for it. If we consider a star expelling material in a specific direction, we can model the system by analogy to a rocket and its expelled fuel, and thus examine velocity change with the Tsiolkovsky rocket equation. From the paper:
There are a number of physical mechanisms responsible for expelling mass during the stars’ life. These include but may not be limited to: unidirectional or focused electromagnetic (EM) flux, solar wind, accelerated solar wind, coronal mass ejections (CMEs), unidirectional neutrino flux, and solar wind thermonuclear fusion. Each mechanism can be treated as an exhaust velocity Vex with a mass flow rate so that the acceleration of the star is analogous to a rocket thrust F = VexMs.
What stands out here is how big the force F = 1016 N — the force needed to accelerate stars like the Sun to this level — is from our terrestrial perspective. It is the equivalent of the force exerted by two billion 106 kg rockets, each accelerating at 3g. Backing out to cosmic scale, though, the force appears less daunting, being 5 orders of magnitude less than the mutual gravitational force between the Earth and the Sun.
The mechanisms of mass loss are many and varied, as noted above, and the paper goes to work on eight of them:
- Unidirectional or focused stellar electromagnetic flux
- Galactic cannibalism
- Stellar mass loss by thermonuclear fusion
- Non-isotropic stellar wind
- Accelerated unidirectional stellar wind
- Coronal mass ejections
- Unidirectional neutrino flux
- Solar wind thermonuclear fusion
Note how many of these demand an existing advanced technology to implement them. In fact, of the eight, only two have solutions that are what Matloff calls ‘mechanistic;’ i.e. operational within nature without technological intervention. These are galactic cannibalism and stellar sass loss by thermonuclear fusion. Neither show promise as a cause for stellar acceleration of this order.
Galactic cannibalism refers to interactions between dwarf galaxies and large galaxies like the Milky Way, with the satellite galaxies being absorbed. This adds to the mass of the primary galaxy and may increase star orbiting velocities, but the authors discount the process because stellar nurseries are also accelerated by galaxy mergers, just as pre-existing stars. Stellar mass loss by thermonuclear fusion due not only to fusion within the core but via the stellar wind — which is in any case omnidirectional — likewise fails to produce the observed acceleration effect across classes of stars.
The other six options all involve the application of advanced technologies to create stellar motion in a specific direction, and some of these don’t work either. Unidirectional coronal mass ejections, for example, even if they could be shaped as thrust, fail to provide the needed energies. What emerge as viable candidates are the combined effects of a unidirectional neutrino jet and an accelerated unidirectional stellar wind “in conjunction with the unidirectional photon jet ejected from the star and non-isotropic stellar wind.” Thus on the accelerated unidirectional stellar wind:
Consider the case of a dual-purpose Dyson/Stapledon megastructure constructed around a star. Confirmation of the existence of such a megastructure would constitute evidence for the existence of a Kardashev Level 2 or higher civilization. A fraction of the star’s radiant output is used to accelerate a fraction of the star’s stellar wind as a unidirectional jet.
Obviously these options take us into science fiction territory, such as the recent Greg Benford/Larry Niven collaboration beginning with Bowl of Heaven (Tor, 2012), where a star in directed motion carries with it a vast environmental shell. So as an example of just one way to do all this, let me quote from an article Benford wrote for Centauri Dreams in 2014 (see Building the Bowl of Heaven):
Our Bowl is a shell more than a hundred million miles across, held to a star by gravity and some electrodynamic forces. The star produces a long jet of hot gas, which is magnetically confined so well it spears through a hole at the crown of the cup-shaped shell. This jet propels the entire system forward – literally, a star turned into the engine of a “ship” that is the shell, the Bowl. On the shell’s inner face, a sprawling civilization dwells…
The jet passes through a Knothole at the “bottom” of the Bowl, out into space, as exhaust. Magnetic fields, entrained on the star surface, wrap around the outgoing jet plasma and confine it, so it does not flare out and paint the interior face of the Bowl — where a whole living ecology thrives, immensely larger than Earth’s area.
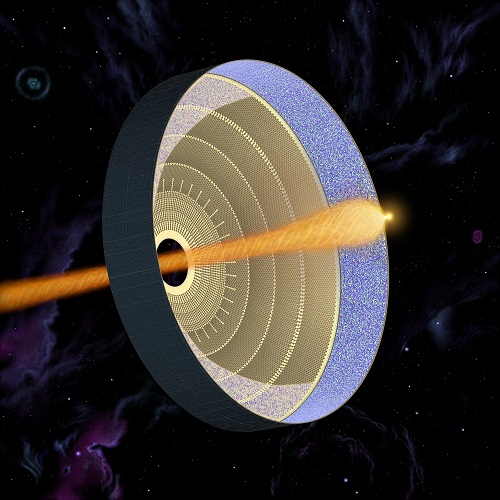
Image: Moving a star as depicted in Bowl of Heaven. Credit: Don Davis.
But the idea of moving stars via technology has a long pedigree. As just one example, let me quote Fritz Zwicky, that fiercely independent and prescient thinker, from an article he published in June, 1961 in Engineering and Science:
In order to exert the necessary thrust on the sun, nuclear fusion reactions could be ignited locally in the sun’s material, causing the ejection of enormously high-speed jets. The necessary nuclear fusion can probably best be ignited through the use of ultrafast particles being shot at the sun. To date there are at least two promising prospects for producing particles of colloidal size with velocities of a thousand kilometers per second or more. Such particles, when impinging on solids, liquids, or dense gases, will generate temperatures of one hundred million degrees Kelvin or higher-quite sufficient to ignite nuclear fusion. The two possibilities for nuclear fusion ignition which I have in mind do not make use of any ideas related to plasmas, and to their constriction and acceleration in electric and magnetic fields…
So could an advanced culture pull this off? The authors are quick to point out that the eight mechanisms they evaluate do not exhaust the range of possibilities, but thus far the physical mechanisms under investigation fail the test unless assisted by a technology. The first order of business, of course, will be to verify the apparent stellar acceleration and then to ponder stellar kinematics in their combined light.
But while we can envision advanced cultures developing the tools to move individual stars, as breathtaking as the concept seems, it appears unlikely in the extreme that entire stellar classes are being moved about simultaneously by megastructures or other technologies.
I think the existence of an explanation within the realm of nature has to be assumed. The question, of course, is just where it is to be found. This spirited paper, cheerfully speculative, contains an open call to the community to investigate anomalous stellar accelerations and produce other hypotheses explaining this curious behavior.
The paper is Kezerashvili, Matloff & Long, “Anomalous Stellar Acceleration: Causes and Consequences,” JBIS Vol. 74 (2021), pp. 269-275 (full text). The Vityazev paper is V. V. Vityazev et al., “New Features of Parenago’s Discontinuity from Gaia DR1 Data,” Astronomy Letters 44, 629-644 (2018). Abstract.
by Paul Gilster | Aug 18, 2021 | Deep Sky Astronomy & Telescopes |
Infrared imagery drawn from Spitzer Space Telescope data, coupled with the massive Gaia Early third Data Release (EDR3), have just given us a new insight into our galaxy’s spiral structure. The Milky Way’s Sagittarius Arm is now shown to have a ‘spur’ of star-forming gas and young stars emerging at a steep angle and stretching some 3,000 light years. The authors of the paper on this work refer to it as “unprecedented in the context of the generally adopted model of the Milky Way spiral structure.”
The spur was a tricky catch, because from our position within the galactic disk we can only see the full spiral structure in galaxies other than our own. But the authors point out that in these galaxies, spiral arms often show smaller-scale structures including ‘spurs,’ which are luminous groupings of stars, and ‘feathers,’ which are dust features. We also find branching in the main arms. Now we’ve identified a spur structure in the Milky Way.
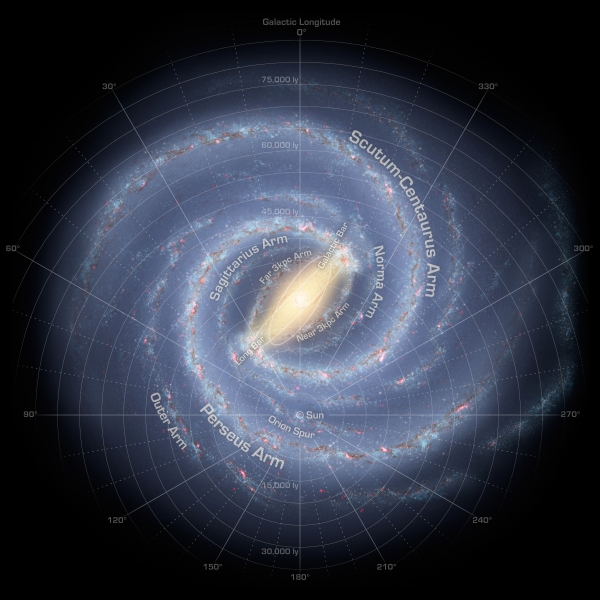
Image: Artist’s concept of the Milky Way. The galaxy’s two major arms (Scutum-Centaurus and Perseus) can be seen attached to the ends of a thick central bar, while the two minor arms (Norma and Sagittarius) are less distinct and located between the major arms. The major arms consist of the highest densities of both young and old stars; the minor arms are primarily filled with gas and pockets of star-forming activity. The new structure (not shown here) has been found to extend from the Sagittarius Arm. Credit: NASA/JPL-Caltech.
Early work on galactic structure going back to the 1950s homed in on nearby star-forming regions in work that helped to define the Sagittarius Arm in the first accepted galactic map. Today we have a great deal more data to work with than earlier researchers. Michael Kuhn (Caltech) and collaborators homed in on the Sagittarius Arm, looking for data on infant stars — the paper refers to ‘young stellar objects’ (YSO) — still nestled in the molecular clouds of their birth nebulae; these are thought to align with the shape of the arms in which they are found. Indeed, in other spiral galaxies star formation follows the features of the spiral pattern.
The researchers drew on a Spitzer-derived catalog called SPICY (Spitzer/IRAC Candidate YSO) to study a nearby portion of the Sagittarius Arm, using the information to map out star-forming regions and compare their actual distribution with models of the arm. They also used a catalog derived from Spitzer data called the Galactic Legacy Infrared Mid-Plane Survey Extraordinaire (GLIMPSE) containing more than 100,000 newborn stars. But it took Gaia to map the result in 3-D.
The European Space Agency’s mission tracks the motions, luminosity, temperature and composition of stars down to magnitude 20. Its most recent data release, EDR3, contains astrometry information on the distances and velocities of these objects. Using EDR3, the authors inferred the parallax and proper motions for their star-forming regions and estimated their radial velocities. The team rightly points to the “renaissance in investigations of Galactic spiral structure within a few kiloparsecs of the Sun” that Gaia’s positional and radial velocity measurements have produced. The Gaia achievement is not exaggerated: Thanks to this mission, we can now examine the position and kinematics of over a billion stars.
Out of all this comes evidence for a long, thin structure of young stars moving roughly with the Sagittarius Arm and in the same direction. Kuhn points out that as the structure of a spiral galaxy becomes more open, its pitch angle increases. If a circle has a pitch angle of 0 degrees, the most recent models of the Milky Way show that the Sagittarius Arm has a pitch angle of 12 degrees. The new structure breaks radically here, with an angle of nearly 60 degrees.
Previous studies have suggested a linear structure in this region, but the high pitch angle of this spur has not previously been noted. According to the authors’ models, the structure would appear as a bright stellar feature from another galaxy, paralleling the same kind of high pitch-angle structures found in many. Gravitational instabilities may account for their formation, with mass concentrations within the arms shearing as a consequence of the galaxy’s rotation. In any case, the authors see the structure as “an excellent laboratory for examining star formation on scales large enough to be compared to extragalactic observations, but with the ability to resolve the mass function, spatial distribution, and kinematics of the individual sources.”
Robert Benjamin (University of Wisconsin-Whitewater) is principal investigator for the GLIMPSE survey:
“Ultimately, this is a reminder that there are many uncertainties about the large-scale structure of the Milky Way, and we need to look at the details if we want to understand that bigger picture. This structure is a small piece of the Milky Way, but it could tell us something significant about the Galaxy as a whole.”
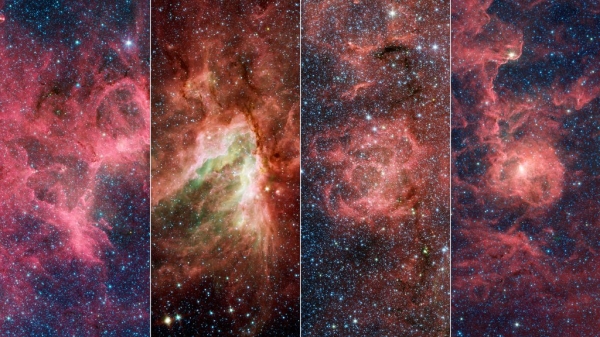
Image: These four nebulae (star-forming clouds of gas and dust) are known for their breathtaking beauty: the Eagle Nebula (which contains the Pillars of Creation), the Omega Nebula, the Trifid Nebula, and the Lagoon Nebula. In the 1950s, a team of astronomers made rough distance measurements to some of the stars in these nebulae and were able to infer the existence of the Sagittarius Arm. Their work provided some of the first evidence of our galaxy’s spiral structure. In the new study, astronomers have shown that these nebulae are part of a substructure within the arm that is angled differently from the rest of the arm. Credit: NASA/JPL-Caltech.
The paper is Kuhn et al., “A high pitch angle structure in the Sagittarius Arm,” Astronomy & Astrophysics Vol. 651, L10 (July 2021). Full text.
by Paul Gilster | Aug 3, 2021 | Deep Sky Astronomy & Telescopes |
The X-ray ‘echoes’ from the Seyfert galaxy I Zwicky 1 occupied us on Friday, but today I want to explore the larger content of black hole research following the news about the relatively nearby active galaxy called Centaurus A. Whereas the X-ray work took data from two X-ray telescopes, NuSTAR and XMM-Newton, the Centaurus A investigation gives us another startling image from the instrument that to my mind has the coolest name of them all when it comes to observing tools — the Event Horizon Telescope.
It was the virtual EHT, of course, that produced the first image of a black hole, the supermassive object at the center of M87. The same observing campaign in 2017 produced the data used in the new paper on Centaurus A. At some 10-13 million light years, Centaurus A is — at radio wavelengths — one of the largest and brightest objects in the sky. Its central black hole is thought to mass about 55 million suns. By contrast, the EHT researchers have estimated the black hole in M87’s center to be 6.5 billion times more massive than the Sun, while our own Sgr A* — the Milky Way’s supermassive black hole — is thought to mass on the order of a ‘mere’ 4.3 million solar masses.
The Centaurus A study, led by Michael Janssen (Max Planck Institute for Radio Astronomy and Radboud University, Nijmegen) presents intriguing data on the galaxy’s enormous jet, as shown in the image below. Notice the range of observatories involved in this work, as listed in the caption. The Event Horizon Telescope data is here being supplemented by ground-based and space-based equipment, reminding us of the essential collaborative nature of the experiment when trying to mount a global interferometric effort and tease the greatest amount of information out of the result.
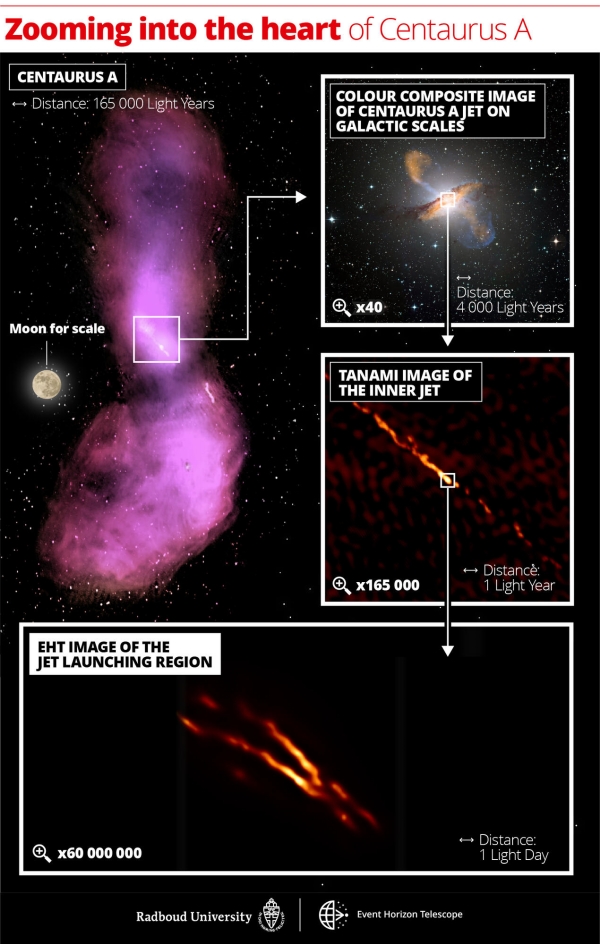
Image: Distance scales uncovered in the Centaurus A jet. The top left image shows how the jet disperses into gas clouds that emit radio waves, captured by the ATCA and Parkes observatories. The top right panel displays a color composite image, with a 40x zoom compared to the first panel to match the size of the galaxy itself. Submillimeter emission from the jet and dust in the galaxy measured by the LABOCA/APEX instrument is shown in orange. X-ray emission from the jet measured by the Chandra spacecraft is shown in blue. Visible white light from the stars in the galaxy has been captured by the MPG/ESO 2.2-metre telescope. The next panel below shows a 165,000x zoom image of the inner radio jet obtained with the TANAMI telescopes. The bottom panel depicts the new highest resolution image of the jet launching region obtained with the EHT at millimeter wavelengths with a 60,000,000x zoom in telescope resolution. Indicated scale bars are shown in light years and light days. Credit: Radboud Univ. Nijmegen; CSIRO/ATNF/I. Feain et al., R. Morganti et al., N. Junkes et al.; ESO/WFI; MPIfR/ESO/APEX/A. Weiß et al.; NASA/CXC/CfA/R. Kraft et al.; TANAMI/C. Müller et al.; EHT/M. Janßen et al.
Supermassive black holes cause the release of vast amounts of energy as some of the gas and dust near the accretion disk is blown into space in the form of jets. There is plenty to work with in the EHT data, and new questions raised, for only the outer edges of the jet appear to emit radiation, another reminder of how much we have to learn about the processes in play in this phenomenon. But let’s home in for now on the quality of the imagery.
For compared to previous work, we see the jet at Centaurus A at 16 times sharper resolution than ever before. The magnification factor here is one billion. EHT astronomers believe they can locate the black hole itself at the launching point of the jet, a location that will be explored in future observations at shorter wavelength and still higher resolution that will incorporate the use of space-based observatories.
The technique at Centaurus A, as it was at M87, was Very Long Baseline Interferometry (VLBI). If black hole jets occur at the stupendous scale we see here, it’s fitting that a planet-sized aperture would be used to see one of them up close. The Event Horizon Telescope originally joined eight telescopes around the globe to create this virtual capability, with other radio dishes around the globe later coming into play as observations continued. More than 300 researchers are involved in the effort worldwide.
We have to go back to 1971 to find the roots of the Event Horizon Telescope, as Heino Falcke points out in his book Light in the Darkness (HarperOne, 2021). This was when Donald Lynden-Bell and Martin Rees predicted that VLBI techniques on the scale of a continent could be used to discover a compact radio source like a black hole at the center of our own galaxy. Seyfert galaxies, bright with radio plasma, were suspected of hosting central black holes, part of a grouping of galaxies known to possess active galactic nuclei (AGN). It made sense that the Milky Way might have its own black hole. Three years later a compact radio source was discovered there.
Thus we learned about Sagittarius A*, a fascinating find but one whose image from Earth was compromised by the dust and hot gas along the galactic disk. The move toward shorter wavelength observation to study an object that was dark at almost every wavelength except that of radio frequency light makes for fascinating reading in Falcke’s book. Puzzles abounded. If Sagittarius A* were a black hole, it seemed a weak one. Quasar 3C 273, if placed in the Milky Way, would be 40 million times brighter.
Falcke wrote his doctoral thesis around the question of what he describes in his book as ‘starved black holes.’ If Sagittarius A* is no more than a weak glimmer compared to some, it implied that the black hole was simply not drawing in the matter needed to produce a stronger signature. If the average quasar consumed one sun per year, his calculations showed that our black hole must suck in ten million times less mass. That’s the equivalent of about three moons per year. From the book:
…contrary to popular belief, black holes generally aren’t wildly voracious monsters: they’re very well behaved and eat only what they’re served. In our imagination, black holes might be giant, but compared to an entire galaxy they’re just little chicks. And like chicks in the nest, black holes must wait for food, must wait for their mother galaxy to feed them with dust and stars. If this doesn’t happen, they waste away, go dark and quiet, and stop growing — just like Sagittarius A*. But they don’t die.
How to build a globe-spanning interferometric network to study Sagittarius A*, or the huge M87* source at the center of that galaxy? With eight observatories around the planet, the radio signals have to be perfectly synchronized to allow the observation, the position of the observatories known to the millimeter and the arrival time of signals received measured with atomic clocks of picosecond precision. As Falcke points out, such a radio telescope is assembled on a computer. Algorithms build the image.
And money builds the interferometer or, at least, the effort needed to coordinate a planet-sized effort like the EHT, and as countless meetings and strategy planning both online and in person continued and proposals were generated — we are talking a process years in the making, of course — M87 began to emerge as a viable target for the first attempt at an image of a black hole. Its black hole is two thousand times farther away — 55 million light years out — but it’s also huge, and estimates of its size had continued to grow as work on the EHT concept continued.
The advantages were many: M87 was easier to see from the northern hemisphere, where most of the EHT’s telescopes were located. It was also not located along the line of sight of the Milky Way’s disk, making it a clearer target. It’s no surprise that, among the EHT’s sources, including Sgr A*, M87 should have become the one whose results were most anticipated.
Falcke brings to the evolution of the EHT the same intensity that Alan Stern brought to the scientific, political and financial effort to build New Horizons in his book Chasing New Horizons (Picador, 2018). His eye for detail makes the observing sites lively places indeed, while he clarifies the technical issues without jargon. This is a project collecting data at 32 gigabits per second, all recorded on hard drives for future processing. As Falcke puts it:
Only after a lengthy process does a tiny image emerge from the giant quantity of data — talk about data reduction! Really we’re only recording static: static from the sky, receiver static, and a small bit of static from the edge of the black hole. Thankfully a large part of the sky and receiver static can be filtered out when the data are processed afterward. The total energy of the static that such a telescope gathers from our cosmic radio source in one night is incomprehensibly small. It’s the equivalent of the energy produced by a strand of hair one millimeter long that falls from a height of half a millimeter in vacuum onto a glass plate. The impact will hardly scratch the glass, but we can measure it.
We know the outcome, but that doesn’t lessen the drama. In April of 2017, the eight EHT observatories — two in Chile, two in Hawaii, one in Spain, one in Mexico, another in Arizona and a last one at the south pole — all pointed at the target in M87. Falcke heads for Málaga, test runs begin via the global network, the observations kick in. There is no way for all eight of the telescopes to measure simultaneously because of differences in location. The work has to be staggered, the data then synchronized. Calibration tests on quasars are conducted, then the first observations of M87 begin. At Málaga:
The telescope turns slowly toward the Virgo constellation, the second largest in the sky. We follow the motion on the display, transfixed. The telescope positions itself to find the right azimuth, or angle along the horizon; its elevation, or vertical angle, is perfect now as well. Same as with any other large movement, we have to do a little adjusting afterward. “Pico Veleta on source M87 and recording, pointing on nearby [quasar] 3C 273,” Krickbaum reports. The plots in the control room show plausible signal levels; the hard drives spin and fill up. A reassuring sign. On our instruments we see how the telescope follows the center of M87, moving counter to the Earth’s rotation. For hours now we swivel back and forth between M87 and a calibration quasar for scans of a few minutes each. Now everything seems to take care of itself.
As morning comes in Spain, the telescopes in Hawaii go into action observing M87, for a time simultaneously with Málaga before Spain shuts down. This is a distance of 10,907 kilometers, Falcke points out, the longest distance in the network. Arizona and Hawaii keep recording data for hours more. And this is only round one. The weather intervenes, then moderates. The words ‘go for VLBI’ take on an urgency like a rocket liftoff.
Consider that to make the Event Horizon Telescope work, you have to coordinate the position of each telescope relative to the sky as well as the time of arrival of the emissions being observed, which means modeling the motion of the Earth, taking into account pole-wandering due to the motion of its oceans and the effects of its atmosphere. Then a supercomputer goes to work looking for common oscillations. This means figuring out correlations between the received data to make sure they depict the same thing.
As Falcke points out, being a millisecond off in your timing means searching through millions of alternatives, which is why the analysis of the EHT’s data takes far longer than making the observations. Using quasars for calibration and testing is critical. It turned out to take nine months just to correlate the observations that produced the famous image of M87’s black hole. Or I should say, its ‘shadow,’ for no light can escape the black hole itself. The imaging teams had to wrestle with the fact that there are numerous ways of turning these data into a final image. We wind up with an image with the resolution that would be produced with an aperture the size of the Earth despite technical glitches, variable weather, and the need to schedule observing times at all the observatories, no mean feat in itself.
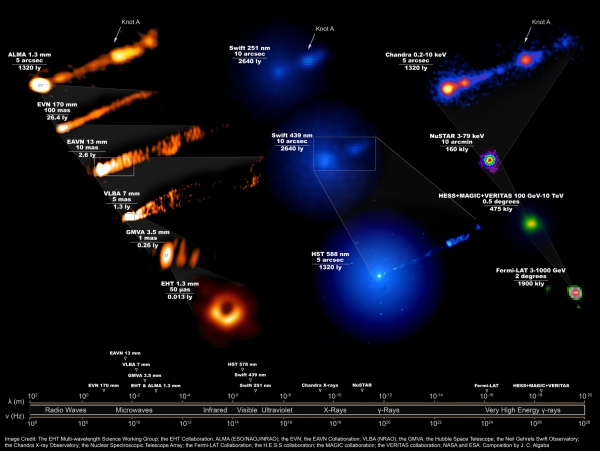
Image: Composite image showing how the M87 system looked, across the entire electromagnetic spectrum, during the Event Horizon Telescope’s April 2017 campaign to take the iconic first image of a black hole. Requiring 19 different facilities on the Earth and in space, this image reveals the enormous scales spanned by the black hole and its forward-pointing jet, launched just outside the event horizon and spanning the entire galaxy. Credit: the EHT Multi-Wavelength Science Working Group; the EHT Collaboration; ALMA (ESO/NAOJ/NRAO); the EVN; the EAVN Collaboration; VLBA (NRAO); the GMVA; the Hubble Space Telescope, the Neil Gehrels Swift Observatory; the Chandra X-ray Observatory; the Nuclear Spectroscopic Telescope Array; the Fermi-LAT Collaboration; the H.E.S.S. collaboration; the MAGIC collaboration; the VERITAS collaboration; NASA and ESA. Composition by J.C. Algaba.
It’s impressive that so many of the simulations the EHT team ran match the image of M87 that emerged, and as Falcke notes, there is an exact correlation between the size of the object and its mass, with the ring of light brightest at the bottom, as gas rotating around the black hole near light speed moves towards us, becoming focused and intensified. 6.5 billion solar masses gives us a black hole with a diameter of about 100 billion kilometers, an event horizon with a circumference four times as large as the orbit of Neptune.
The fact that we can make such measurements and produce such images doing astronomy at planet-wide scale is a testament to the power of scientific collaboration and raw human persistence. The EHT is indeed cause for celebration, as the new paper on Centaurus A affirms.
The paper on Centaurus A is Janssen et al., “Event Horizon Telescope observations of the jet launching and collimation zone in Centaurus A,” Nature Astronomy 19 July 2021 (abstract / full text).