Science fiction writers have a new challenge this morning: To come up with a plot that takes in not just the galaxy and not just the Local Group in which the Milky Way resides, but the far larger home of both. Laniakea is the name of this supercluster, after a Hawaiian word meaning ‘immense heaven.’ And immense it is. Superclusters are made up of groups like the Local Group — each of these contain dozens of galaxies — and clusters that contain hundreds more, interconnected by a filamentary web whose boundaries have proven hard to define.
Where does one supercluster begin and another end? As explained in a cover story in the September 4 issue of Nature, an emerging way to tune up our cosmic maps is to look at the effect of large-scale structures on the movements of galaxies. A team under R. Brent Tully (University of Hawaii at Manoa) has been using data from radio telescopes to study the velocities of 8000 galaxies, adjusting for the universe’s accelerating expansion to create a map of the cosmic flow of these galaxies as determined by gravitational effects.
The boundaries between superclusters, such as those between Laniakea and the Perseus-Pisces Supercluster, are where the galactic flows diverge and neighboring structures shear apart. As this National Radio Astronomy Observatory news release points out, within the boundaries of the Laniakea Supercluster, the motions of galaxies are directed inward. In other superclusters, the flow of galaxies goes toward a different gravitational center.
This is how our horizons get adjusted. Previously we thought of the Milky Way as part of the Virgo Supercluster, but now we see even this region as just part of the far larger Laniakea Supercluster. We’re talking about a structure some 520 million light years in diameter that contains the mass of one hundred million billion suns across a staggering 100,000 galaxies. And just as the Sun is in the galactic ‘suburbs’ of the Milky Way, a long way from the galaxy’s teeming center, so the Milky Way itself lies on the outskirts of the Laniakea Supercluster.
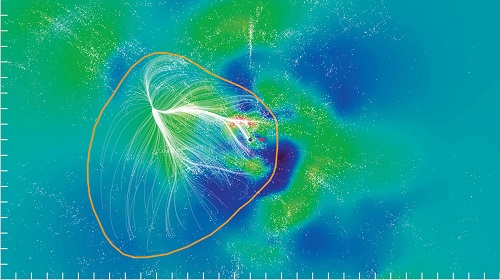
Image: A slice of the Laniakea Supercluster in the supergalactic equatorial plane — an imaginary plane containing many of the most massive clusters in this structure. The colors represent density within this slice, with red for high densities and blue for voids — areas with relatively little matter. Individual galaxies are shown as white dots. Velocity flow streams within the region gravitationally dominated by Laniakea are shown in white, while dark blue flow lines are away from the Laniakea local basin of attraction. The orange contour encloses the outer limits of these streams, a diameter of about 160 Mpc. This region contains the mass of about 100 million billion suns. Credit: SDvision interactive visualization software by DP at CEA/Saclay, France.
Those of us with an interest in Polynesia will love the name Laniakea, which was chosen to honor the Polynesian sailors who used their deep knowledge of the night sky to navigate across the Pacific. If you look through the essays in Interstellar Migration and the Human Experience (University of California Press, 1985), you’ll find several that dwell on the historical example of the Polynesian navigators as a way of examining future migration into the stars. The theme resonates and I invariably hear it mentioned at the various conferences on interstellar flight.
The diagrams below offer another way of viewing the gravitational interactions that pull together the immense supercluster. You’ll notice the Great Attractor, a gravitational focal point that influences the motion of galaxy clusters including our own Local Group. The NRAO refers to it as a ‘gravitational valley’ whose effects can be felt across the Laniakea Supercluster.
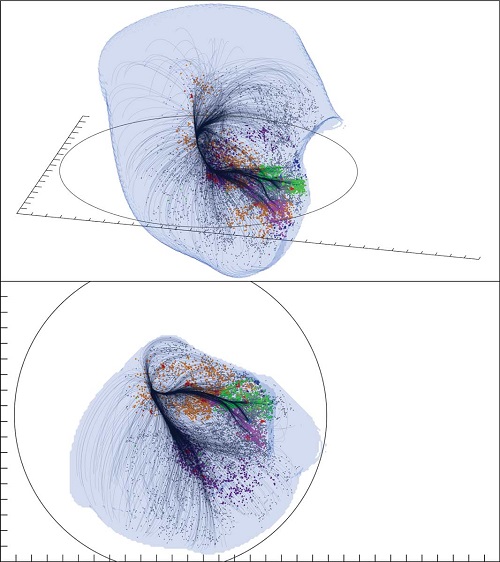
Image: Two views of the Laniakea Supercluster. The outer surface shows the region dominated by Laniakea’s gravity. The streamlines shown in black trace the paths along which galaxies flow as they are pulled closer inside the supercluster. Individual galaxies’ colors distinguish major components within the Laniakea Supercluster: the historical Local Supercluster in green, the Great Attractor region in orange, the Pavo-Indus filament in purple, and structures including the Antlia Wall and Fornax-Eridanus cloud in magenta. Credit: SDvision interactive visualization software by DP at CEA/Saclay, France.
Have a look at this video from Nature to see the whole supercluster set in motion.
So now we know that our home supercluster is actually 100 times larger in volume and mass than we previously thought. In an article summarizing these findings in Nature, Elizabeth Gibney points out that a somewhat different definition of a supercluster is being used by Gayoung Chon (Max Planck Institute for Extraterrestrial Physics, Germany) and colleagues, who base their definition on structures that will one day collapse into a single object, something that cannot be said for Laniakea because some of its galaxies will always move away from each other. Clearly, the definition of a supercluster is a work in progress, but let’s hope the name sticks.
The paper is Tully et al., “The Laniakea supercluster of galaxies,” Nature 513 (4 September 2014), 71-73 (abstract).


Well, that’s good news, because it means that in about 100 gigayears, when all other superclusters will have moved beyond our observational horizon due to the universal expansion, we will be left with about 100x as many stars as we previously thought.
Looking at the gravitational flow map, I can’t help but think of it as a roadmap of the humanity’s future migration and expansion. Riding the flow all the way down to the Great Attractor, checking out the local sights with exotic names such as Fornax-Eridanus or Pavo-Indus. Maybe one day Pavo-Indus will be considered to be best place to live with our own Local cluster the armpit.
Once we get to the very center of the Great Attractor, perhaps we should build something interesting there just for fun, a nested spheres of Platonic solids the size of a solar system?
Wonder if average distribution of intelligent technological life will be found to be approximately one civilization per supercluster?
I hope that in 100 billion years we’ll be able to freely travel between galaxies to see whatever we want, at any given point in time, and manipulate the expansion of the universe. Looks very pretty, though. And I, too, hope the name sticks–sounds much better than a series of hyphenated letters and numbers.
Man, we are the hicks from the boonies. I want to drive into town! :)
If voids are in blue, galaxies are white dots and the dense parts are red, what does the green represent in the first image?
“Wonder if average distribution of intelligent technological life will be found to be approximately one civilization per supercluster?”
What a big waste of space!
Anyway, after reading this article I remember Baxter’s sf novel Ring which is quite intriguing itself. Also a reminder that we’re not numero uno in this universe because it’s very hard to believe there hasn’t had any advanced civilization for more than 5 G years.
I’m not sure the relative position of this supercluster with other superclusters, http://www.atlasoftheuniverse.com/superc.html
Here is a nice video: https://www.youtube.com/watch?v=Ayj4p3WFxGk
Hiro: “I’m not sure the relative position of this supercluster with other superclusters”.
Good question, apparently the new supercluster includes the Pavo-Indus supercluster and Fornax-Eridanus supercluster, but not the Perseus-Pisces Supercluster.
So the question is now: which of the former superclusters are included and which neighboring superclusters are outside?
““Wonder if average distribution of intelligent technological life will be found to be approximately one civilization per supercluster?”
What a big waste of space!”
Or a big opportunity! Little competition within the supercluster. And mind you, lack of technological civilization does not imply lack of life or even lack of intelligence.
Hiro said on September 4, 2014 at 19:38:
“Wonder if average distribution of intelligent technological life will be found to be approximately one civilization per supercluster?”
“What a big waste of space!”
My strong doubts about so few intelligent life forms in such a wide and stellarly populated cosmic area aside, perhaps if there is any truth to it this just means that life is not the main focus or goal of our Universe despite our quite biased views on such matters.
Look at the scale being shown in regards to Laniakea: Our Milky Way galaxy is a mere dot merged with billions of other dots – and you are wondering why an advanced ETI isn’t making itself known and visible? They would practically have to be gods for lack of a better word to visibly manipulate so much matter. A whole Kardashev Type 3 civilization would be just as lost as our Milky Way is. So would a Type 4 if you can buy into that level of advancement.
Of course there is the interesting little idea that our Universe is alive if you want to consider that galaxies are living beings and we are just too darn small, too young, and way too immersed in the trees (stars) to see the forests (galactic superclusters).
And now that we know the Virgo supercluster ain’t quite so super any more, I wonder how that will affect the plans mentioned here:
https://centauri-dreams.org/?p=30916
Side note: Isn’t it amazing how a bunch of microbes like us can even talk about celestial objects and scales so utterly vast that we aren’t even really in the equation? And just a drop in the bucket ago timewise we barely began to realize we live on a planet in space circling a star. The true nature of galaxies did not even come into the generally accepted equation until less than a century ago!
http://apod.nasa.gov/diamond_jubilee/debate20.html
Speaking of immense scales, here is a timescale of the future. Basically we have about 100 trillion years to either “fix” this Universe or find (or make) a new one.
http://www.fromquarkstoquasars.com/the-future-of-the-universe/
Here is the AJ paper online:
http://iopscience.iop.org/1538-3881/146/3/69/pdf/1538-3881_146_3_69.pdf
@Andrew Palfreyman: This explains the Fermi paradox. The Milky Way is a fly-over galaxy between the Great Attractor of Laniakea and the Great Attractor of Perseus-Pisces.
Nope, because as noted in the Nature summary article, Laniakea is probably not going to collapse into a single object:
We will visit these the heart the cluster in VIVO? not so sure.
With high technology of a Galaxy controlled by our descendants,
I take it given they we wont be seeking fallow planets anymore.
Not when they will have the technology to create any element
starting with a base of high energy and H2. The high tech could create any conceivable Living Space we needed. It could even make a Proto-Deity
of any beings descended from us by creating niche manufacture civilizations with sentient beings to interact with. Made of Matter Not Simulated.
How to compete against the pull this type introversion. The most dangerous of all pitfalls of the far future (barring pissing off a very powerful transcendental being)
If find it hard to believe anything but Machine
beings of our design will be visiting the heart of these Clusters, not our descendants per se.
@Securis: For certain values of “fly”
You are correct, life is neither focus nor goal of the universe.
Rather, the universe exists as a necessary precondition to our existence. The universe must exist for there to be life. Life must exist for there to me. I must exist for these thoughts to be thought. Without a universe, I could not exist, and this discussion would never take place. Cogito, ergo sum, ergo “the universe” (however you say it in latin) …
Note, though, that the universe only has to be big enough for one instance of life. More would be redundant, and therefore not likely.
Ooops, did I just say that out loud? ;-)
That is a LOT of room for one planet for life. In that case it really would seem like a waste of space.
So again, perhaps life is not the major point of existence. Or life IS the focus but it is not what we tiny little young barely aware creatures think it is.
E pluribus uranium.
Paul, I actually did write such a story, “Relativistic Effects,”, in 1982. It’s in several collections of mine. In it a runaway ramscoop, a la Tau Zero, collides with whole galaxies as it surfs them in a supercluster.
@RobFlores
If we design them [machines] to succeed us, they are, by all intents and purposes, our descendants. Our bodies are nothing more than interstellar vessels; there’s no reason why we couldn’t continue our endeavors in different, possibly more effective ones.
@Eniac
We are the universe observing itself. Although I’m not entirely sure how to interpret your philosophy, the fact that this type of occurrence is happening means that the universe has some form of consciousness, which may or may not be observable outside of itself. In the same way that we can reproduce consciousness in many different forms–virtually, artistically, biologically (i.e. replication via offspring or other forms of procreation), and/or in thought, demonstrates a small piece of how the universe operates–how it thinks. I would even go so far as to say that just as we are learning about the universe, the universe may itself be learning about its own existence, (through, independently or simultaneously with) its other forms of being, manifestations/phases. There is also the possibility that an outside observer, on a grand macroscopic scale (or some unknown plane) may have initiated everything happening and itself is observing and/or going through some type of extra-planar/dimensional/existential phase transition—evolving.
We should be mindful that the only thing limiting us from our own imaginations is knowledge, in the most general sense of the word. Ex.) I can imagine becoming Laniakea, distorting the current galactic order, deviating from my gravitational bounds–I just have no idea how to actually make it a reality. This awareness is profound and (if only one physical universe exists or can be experienced by absolute limitations) it may indeed suggest the redundancy you assume. The only problem standing in the way of that single assumption is a multitude of other assumptions, lacking proof or evidence to coincide with or reject the notion.
@ljk & Hiro
Furthermore, our knowledge of life outside of our own experience is stunted considering our gradual rate of learning, rather than possessing universal omniscience. This, indeed, may be why the universe is learning, too: omniscience just may not exist, at all. The same could also be conjectured towards omnipotence and omnipresence–all things must be learned, must evolve, must continue to, in a sense, expand.
If we are to consider (or allow) the imaginary as reality, then everything and anything can be falsified or verified–there are no bounds, save for non-existence. This being based on the fact that by using the imagination to imagine non-existence, you have just brought such a thought (that which does not exist) into existence (which does not make sense or seem viable/possible). I’m sure there is a scientific term for such a paradox, I’m just not aware of it, maybe someone can further enlighten me with terminology.
I believe a form of such a concept is prevalent in the religious realms, particularly in Buddhism and other eastern religions–some type of correlations or contrasting between “impermanence” and “nirvana”? And also in middle-easter/western religious philosophy I believe there is a concept of good and evil/heaven and hell representing existent/non-existent correlations in varying “theodicies”. Not prepared to try to translate such ideologies into the scientific realm (and have no intention to), but it does seem interesting and worth immersing oneself in, to possibly broaden perspective.
And to prevent my comment from appearing logically fallacious in saying that omnipresence, omnipotence and omniscience may not exist and, after, saying that nothing can not-exist; what is meant is: we will never know what it means to be any of those things. They would be the incomprehensibles (sole impossibilities) of the universe, in my above assumption.
No, Joelle, the universe does not think. It simply evolves according to its equations (which, of course, in turn are the way they are to make this possible). We, as one rare and minor component of this universe, are the ones that think.
We think we are special, and our universe is special. Not so. There are uncountable other possible universes, with a vanishing fraction (but still uncountably large number) containing “thinking” (according to their definition) beings operating under the same illusion.
OK, I will try my best to explain what I was trying to get across in my above comment:
@ Eniac
First, what is a thought?–Simply, a manipulation of information; for us, this is done by the brain. Does the universe manipulate information?–Yes; for it, physical information identified through causal relationships and more broadly this inevitably includes the former act of the human brain within it, too.
And what mathematical representation or equations explain one [a thought]? If a thought exists in the universe, can not such equations be applied to both [the universe and a thought] through morphism, specifically automorphism [note: a universal property]?
Also, what did I say in my original comment to make you think that I was implying anything as special—or, what would make you think there is anything wrong with thinking the universe is special?–How can what is special be objectified to a human being in the universe? More importantly, why or why not would it matter?
Secondly, as that single component you predict (which implies a finite quantity), let’s assume ourselves as solutions in those proposed systems of universal equations and our thoughts in the universe as expressions. Mathematically, as expressions, thoughts can be typified by (our) operation, able of representation by function(s). Now, let’s assume our operation as: observing (acting in and thinking of) the universe. In such an equation, the universe can think, through one of its mathematical solutions, by its own well-formed formulation. Its formula, representing a commensurability based in constructs of universal properties evident to human objectivity.
Third, if we are the only (or a rare) life form in our own universe capable of this ability per what I got from your redundancy argument, then this argument is even moreso amplified contrary to your depreciation of specialty–and would imply life as the universe peering into its own existence, which if limited to life itself (depending on the finite quantity) makes life, at least to some people, subjectively special. Mathematically, can not this realization be represented through the property of existence and uniqueness?
(cont.)
A video from last year I remember watching concerning some of the questions I raised about non-existence: 2013 Isaac Asimov Memorial Debate: The Existence of Nothing
https://www.youtube.com/watch?v=1OLz6uUuMp8
Not a fan of the debate, but I believe the conclusion of the debated topic in the video is that “nothing” can’t exist–a paradoxical idea we still aren’t quite able to wrap our minds around. Such a conclusion seems not to really give any definitive answer apparent to us, which is how I came to my above ideas about omniscience.
The point being, none of us, neither you or I, can argue in definitive representation for things we don’t know or can experience. We can only predict. You don’t know if there are other universes–you know that they may be possible, because you can think of them: an expression of your operation, enabled through your function in the universal equation(s)’, whose existence formulated and initiated said human objectivity. You don’t know of any other beings operating under the same illusion–but you can think of them. Mathematically, these concepts represent unknowns. And until the variables are given solutions, that objectivity remains in a subjective, loosely syntactical, expressive realm.
In addition, per mathematical identities, omniscience would be possible only if the universe was self-evident in its expressions (i.e. human thought). Obviously, for humans, it is not. The omniscience, omnipresence and omnipotence conjectures arise as a result of reachability problems, considering our emergence from an (assumed) fixed state resulting from the universe, especially whilst observing the infinite density and temperature at a finite time in the past; the space-time singularity.
The solutions to such problems can only be attained by answering the questions of where did the universe(s) come from, where is it going, how, is or isn’t there a why, will we ever find out and what will we experience/observe as and if we learn these things through our increasing correlations?
From one Laniakean to another,
Joëlle :)
Joelle:
Aloha, fellow Laniakean !
I would define thought a bit narrower than you do, otherwise every light switch in my house could be said to have thoughts.
My second paragraph was not meant to contradict you, it was just a thought I wanted to express. I think it is an important one because it perfectly reconciles the uniqueness of life in the universe with the Copernican Principle at its most extreme.
To the subject of existence, and whether we know what exists or not: I would propose that we do not care whether a universe ‘exists’ or not, indeed, we should declare such statement meaningless. In any hypothetical universe where there are hypothetical thinking beings, to those hypothetical beings their hypothetical universe would look as real as ours looks to us. We therefore lack any grounds in distinguishing between the hypothetical and the real.
This cleans up quite neatly any misgivings we might have about alternate universes. We postulate hypothetical alternate universes whenever we use the term ‘should have’ or ‘could have’, so we are intrinsically very familiar with the concept, it comes naturally. The only thing making it uncomfortable is the distinction between that which is real and that which is hypothetical. The solution is that all universes are hypothetical, the one that we call “real” is simply the one we are part of. In other words: Reality is a matter of perspective, nothing else.
I think this train of thought also can clean up a lot of the thorny issues around the interpretation of quantum mechanics and the nature of time, but I am going to leave the elaboration on that as an exercise to the reader
:)
How big is this Laniakea supercluster compared to the Shapley supercluster or the Horologium supercluster?
I believe we are still moving toward the Shapley concentration, therefore the Great Attractor isn’t the local dominance in the radius around 1 billion light years.
“I would define thought a bit narrower than you do, otherwise every light switch in my house could be said to have thoughts.”
Exactly. They certainly could–as well as uncertainly (in fact, this reality exists between you and me; neither of us truthfully knows each others thoughts or even if one of the other is thinking at all). Such is why we are moved to use syntactical language to define the scale of boundaries to confine relationships semantically. Really, the operation of “observing” in my ideas is based primarily on the crazy mess involving Bohr’s Copenhagen interpretation of quantum mechanics, Schrödinger’s cat and additionally the EPR paradox. In Einstein’s Cosmos: How Albert Einstein’s Vision Transformed Our Understanding of Space and Time, Michio Kaku does a fine job touching on the issues in the seventh chapter of the book, and goes on to very elegantly write, “[…] the process of observation determines the final state of an object.”(pg. 170) and later, “There is a world of difference between the possession of information and its transmission.”(pg. 173) (Michio Kaku, 2004)
Now, those statements are both true and the “many worlds” interpretation allows for the continuous evolution of quantum systems to enable the language to flow freely from the universe, to us and our light switch; although experimentally, “objective collapse theories” are where interpretation and language become important in trying to decide whether observing need be a conscious or unconscious act. I would exercise my elaboration on such decisions to redefine “unconsciousness” as not being the absence or non-existence of consciousness (as related to thought), but simply as a subconscious state. I would argue this by making consciousness applicable to phase transitions–i.e. phases of matter in general, as represented by the systems of matter that (may) give rise to it [consciousness/thought] in the first place.
Meaning: consider we on the Earth represented all life in the universe and suddenly that life came to an end from a giant asteroid collision. Does the information we manipulated when we were still alive go out of existence?–No, the causality of that manipulation remains in tact. All that has happened is a transition from one phase to another, influencing the interactions between consciousness and other physical systems in different [more or less probable] ways: a simplicity of the laws of the conservation of energy and its potential as related to the human system of observation.
@Hiro
In the original paper it is acknowledged that, “The dominant flow is toward the Shapley concentration of galaxies.” and later in the same paragraph, “In other words, essentially the entire volume being displayed is involved in a flow
toward Shapley. This proposition will be explored in a future publication.” (preprint: http://arxiv.org/pdf/1409.0880v1.pdf)
Your observation is also confirmed here: X-rays Reveal What Makes the Milky Way Move http://www.ifa.hawaii.edu/info/press-releases/kocevski-1-06/
Our Place in the Universe: Welcome to Laniakea
By Phil Plait
When I was a kid, playing with my fellow nerdlings, we used to try to come up with the most specific address we could for ourselves—including the whole Universe. It would go something like this: “Phil Plait, 123 Main St., Springfield, Virginia, United States of America, Earth, Solar System, Orion Spiral Arm, Milky Way Galaxy, Local Group, Virgo Supercluster, Universe.”
It looks like we can now add another locality, squeezed in between the last two: Laniakea (la-NEE-uh-KAY-uh I think is pretty close to how you pronounce it), a galactic supercluster. The folks involved put together a video explaining it, which may help before I launch into my own discussion of it:
Full article here:
http://www.slate.com/blogs/bad_astronomy/2014/09/04/laniakea_our_local_supercluster.html
To quote:
The border of Laniakea isn’t well-defined, but the astronomers decided how to get a sense of it: its gravity. Put a galaxy near Laniakea; if it falls toward the supercluster then it’s inside the border; if it falls away toward some other supercluster than it’s outside. As definitions go it’s not so bad. It’s not the be-all-end-all; as another astronomer points out in the Nature news article, it doesn’t tell you what the eventual fate of the supercluster is (which depends on its mass and size). Like most definitions, it depends on the question you’re trying to answer. In this case, it’s more of a guideline than a definition, and I’m OK with that.
Astronomy is both ennobling and humbling. It tells us our place in the Universe, which can make you feel small … but don’t forget that we’re a part of that Universe, and the fact that we can figure this stuff out at all makes us very big indeed.
http://arxiv.org/abs/1408.4795
Astrosociology: Interwiews about an infinite universe
Erik Høg (Niels Bohr Institute)
(Submitted on 21 Aug 2014)
If the universe is infinite now it has always been infinite. This is the opinion of many astronomers today as can be concluded from the following series of interviews, but the opinions differ much more than I had expected. Many astronomers do not have a clear opinion on this matter. Others have a clear opinion, but very different from the majority. Detailed arguments by two experts on general relativity are also included.
Observations show that the universe is flat, i.e. the curvature is zero within the small uncertainty of measurements. This implies an infinite universe, though most probably we will never know that for certain.
For comparison with the recent interviews, opinions during the past 2300 years since Aristotle about the universe being finite or infinite have been collected from literature, and it appears that the scientists often had quite definite opinions. \c{opyright} Anita Publications. All rights reserved.
Comments: 8 pages, 1 table. In: Asian Journal of Physics Vol. 23, Nos 1 & 2 (2014), Special Issue on History of Physics & Astronomy, Guest Editor: Virginia Trimble
Subjects: History and Philosophy of Physics (physics.hist-ph); Popular Physics (physics.pop-ph)
Cite as: arXiv:1408.4795 [physics.hist-ph]
(or arXiv:1408.4795v1 [physics.hist-ph] for this version)
Submission history
From: Erik Høg [view email]
[v1] Thu, 21 Aug 2014 05:45:23 GMT (834kb)
http://arxiv.org/ftp/arxiv/papers/1408/1408.4795.pdf
September 19, 2014
“Gravity will Eventually Create a Universe with Only a Few Mega-Galaxies”
Massive galaxies in the Universe have stopped making their own stars and are instead cannibalising nearby galaxies, according to research by Australian scientists. Astronomers looked at more than 22,000 galaxies and found that while smaller galaxies were very efficient at creating stars from gas, the most massive galaxies were much less efficient at star formation, producing hardly any new stars themselves, and instead grew by eating other galaxies.
Ultimately, gravity is expected to cause all the galaxies in bound groups and clusters to merge into a few super-giant galaxies, although we will have to wait many billions of years before that happens. “If you waited a really, really, really long time that would eventually happen but by really long I mean many times the age of the Universe so far,” said Aaron Robotham based at The University of Western Australia node of the International Centre for Radio Astronomy Research (ICRAR)
The image above shows IC 1101, a supergiant elliptical galaxy of approximately 6 million light-years across, which makes it the largest known galaxy discovered to date. It lies about 1.07 billion light-years away from Earth in the constellation of Virgo (the Virgin), and is made up of more than 100 trillion stars (for comparison, our Milky Way has about 300 billion stars), this galaxy is the extremely bright object at the center of Abell 2029, a massive cluster of thousands of galaxies. Being one of the most luminous galaxies ever seen, IC 1101 emits more than one quarter of the total light from this galaxy cluster.
IC 1101 is more than 50 times the size of the Milky Way (which is some 100,000–120,000 light-years across) and 2,000 times as massive. If it were in place of the Milky Way galaxy, it would swallow up the Magellanic Clouds, the Andromeda Galaxy, and the Triangulum Galaxy.
IC 1101 owes its size to many collisions of smaller galaxies about the size of the Milky Way and Andromeda galaxies. As expected, the huge galaxy is giving birth to very few new stars. Unless it continues to collide and join with other younger galaxies, IC 1101 will eventually fade away.
The study was released today in the journal Monthly Notices of the Royal Astronomical Society, published by Oxford University Press.
“All galaxies start off small and grow by collecting gas and quite efficiently turning it into stars,” said Robotham. “Then every now and then they get completely cannibalised by some much larger galaxy.”
Full article here:
http://www.dailygalaxy.com/my_weblog/2014/09/gravity-will-eventually-create-a-universe-with-only-a-few-mega-galaxies.html
Thanks ljk, and thanks for the string of fascinating replies. I can’t add anything to the previous other than my own take on the ideas presented but I would like to mention one thought in reference to Eniac…
“Note, though, that the universe only has to be big enough for one instance of life. More would be redundant, and therefore not likely.
Ooops, did I just say that out loud? ;-)”
As to the likelihood of redundancy; maybe the converse is true. When looking at examples from earthly life we see redundancy on a stupendous scale… coral sperm and egg clouds, billions of spores in a single puffball fungi, tens of thousands of seeds released from a single tree after having caught some windblown pollen from kms away. To my mind, if the conditions are favourable for a single instance then you will get more (scales inversely with compexity though).
Where does intelligence of a level that we ourselves find familiar fit in? We cannot be the pinnacle as that precludes the possibility of improvement and we are clearly not through evolving yet. I ponder just where we are on the spectrum of intelligence. But there should be plenty of other intelligences out there even though they will constitute a small percentage of the total amount of self-replicating chemical-dross that collected in the right places to allow complexity, namely planetary surfaces.
As to the notion of what’s ‘real’ in connection with the universe(s) as a whole/ensemble then we could get even more bogged-down by bringing in time’s arrow, entropy and the whole notion of feeling obliged to propose a ‘past conjecture’ in the first place as the alternative is too hard to comprehend or take seriously. Better to think that the universe (hubble volume and some distance beyond) exists in such a state as to not preclude the type of complex chemistry we call life, then it doesn’t need to be anthropomorphised and given ‘goals’ or ‘foci’. My own bias is that treating the universe as if it has a reason or purpose is spiritual at worst and philosophical at best but not scientific. It doesn’t have designs, it’s not a computer (but may be a sim ;) ) and it isn’t alive/thinking (only small sub-parts are)… it just is and it’s a question of how rather than why.
@Mark Zambelli
Quantum mechanics really makes it very easy to be able to accept anything as real or possible, including “spiritual” or philosophical scenarios that can become (or be made) scientific, mainly due to the process of observation. Meaning, if there are no observers, yet a universe, then how and why become irrelevant–that universe might as well not be there at all–scientifically, such a universe doesn’t exist; to science, that universe could represent a nothing :). We must remember that science is a human observational construct, equally affected by the limitations or freedoms of human observation… a fancy way of saying: still kinda subjective, but good enough on the classical level. Now, total or absolute objectivity could be seen as a goal or purpose of what the universe (or intelligence) may produce? Who knows, maybe evolution leads to an observationally superposed existence–would be awesome, but paradoxical until you got to such a point, at least based off of our current understanding (which isn’t really saying much, anyway).
It has recently become trendy in the theoretical physics community to fit the entirety of all fundamental physical systems into a computational model, obviously for the magnificent implications it would have in not only observing the way the universe works, but also in more accurately predicting, determining and manipulating it. Quantum information science would appear to give, at least, the strongest basis for which to computerize the universe, which would, more than anything, serve to aid our own observational biases in a more objective way.
Thus, by examining our own intelligence, seemingly, the questions of “how” lead us to why; “why”, being what the how has allowed us to see it as–if information is more fundamental than physical instantiation, which quantum mechanics proves is the case, then Wheeler’s “it from bit” (http://en.wikipedia.org/wiki/Digital_physics#Wheeler.27s_.22it_from_bit.22) sums up the picture we would hope to bring into realization: information processing in a causal chain of hows and whys.
Although, there are some strong arguments against it; you may be interested in Sir Roger Penrose’s work on Orchestrated objective reduction (Orch-OR) and his books, especially ‘The Emperor’s New Mind’, in which he argues against the notion of modeling human consciousness (being based on underlying quantum information processes itself) as a computer.
Personally, I think he’s doing a lot of important (and successful) work for cosmologizing consciousness, but also think he’s too old and stubborn to realize that his work will lead to doing the opposite of what he is arguing against, much in the same way Einstein had a problem with entanglement. He also has his own interpretation of quantum mechanics named after him, also based in objective collapse theory. http://en.wikipedia.org/wiki/Penrose_interpretation
Ripples in the Milky Way galaxy may mean there are a LOT more stars than currently thought – which means more exoworlds and perhaps more chances for alien life.
http://news.rpi.edu/content/2015/03/09/rippling-milky-way-may-be-much-larger-previously-estimated