Our recent discussion of Richard Gott and Robert Vanderbei’s Sizing Up the Universe has me thinking about representing unfathomably huge scenarios in two-dimensional media, as Gott managed to do so brilliantly with his four-page gatefold map of the universe. How to manage such a feat, and the theory behind map-making of all kinds, can be found in the book, and all of it came to mind as I looked at Ashland Astronomy Studio’s new Stars of the Northern Hemisphere poster. A full color sky map on a 36 x 24 glossy sheet, it’s a handsome rendition of over 2400 stars.
Centauri Dreams regular Erik Anderson is the creator, and he’s been careful to add — beyond the inset closeups of the Pleiades and Hyades star clusters, star names, asterisms and coordinate systems — the location of exoplanet host stars. Exoplanet charting is indeed the new frontier, a depiction of new lands that calls to mind the painstaking efforts of seafaring expeditions that mapped the Pacific archipelagos and the coasts of Africa and South America. Now the trick is not letting the exoplanet count swamp our cartographers, for we’ve already passed 500 exoplanets and there’s every indication that the number will quickly double and more as Kepler results multiply.
The Pioneer Anomaly Resolved?
8.74 x 10⁻¹⁰ m/s2 isn’t much, but it’s an apparent Sun-ward acceleration sufficient to throw the paths of our Pioneer spacecraft off by a few hundred miles from where they ought to be each year. Noticing the effect in 1980, astronomer John Anderson, who was leading the analysis of Pioneer Doppler ranging data as part of a study of gravitational effects in the outer Solar System, came to the conclusion that outgassing from the spacecraft thrusters was responsible, but the effect persisted longer than it should and a whole range of alternate theories soon came into play after Michael Martin Nieto (Los Alamos National Laboratory) began to study the anomaly in terms of modified Newtonian dynamics (MOND).
The background is given in a fine article by Natalie Wolchover for PopSci. What accounted for Nieto’s fascination was the fact that the value of the anomaly almost exactly equaled the speed of light multiplied by the Hubble constant. At that point, with the possibility that the Pioneers were telling us something fundamental about physics, the Pioneer anomaly took on a life of its own. The discovery of dark energy in the same year that Anderson, Nieto and Slava Turyshev announced their findings about the Pioneer acceleration in Physical Review Letters only added to the interest, and hundreds of papers, many but hardly all on MOND notions, followed.
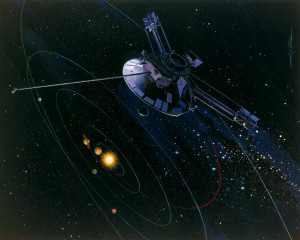
Image: The Pioneer spacecraft opened up an entire sub-field of studies as what some thought to be a gravitational anomaly was identified. Credit: NASA.
Were the Pioneer probes measuring the cosmic expansion whose effects are now thought to be intertwined with dark energy? It was one amongst a sea of possibilities. Wolchover’s article describes how Viktor Toth, running an independent analysis using home computers, became skeptical of the earlier work of Anderson and Turyshev and later, with Turyshev, became instrumental in saving the 30-plus years of Pioneer Doppler data and logbooks. With the help of a retired Pioneer mission control engineer named Larry Kellogg, the two acquired Pioneer telemetry data and went back to work from scratch on a much more thorough analysis.
That was five years ago. The result:
Using the telemetry data, the two scientists created an extremely elaborate “finite element” 3-D computer model of each Pioneer spacecraft, in which the thermal properties of 100,000 positions on their surfaces are independently tracked for the duration of the 30-year mission. Everything there is to know about heat conduction across the spacecraft’s surfaces, as well as the way that heat flow and temperature declined over time as the power of the generators lessened, they know. The results of the telemetry analysis? “The heat recoil force accounts for part of the acceleration,” said Turyshev. They wouldn’t tell me how significant a part. (Turyshev: “We’d like to publish that in the scientific literature.”) But according to Toth, “You can take it to the bank that whatever remains of the anomaly after accounting for that thermal acceleration, it will at most be much less than the canonical value of 8.74 x 10⁻¹⁰ m/s2, and then, mind you, all those wonderful numerical coincidences people talk about are destroyed.”
If the Pioneer acceleration declines with time, it’s obviously not the constant force it was originally thought to be. The question of decay in that acceleration, and whether the acceleration is indeed in the direction of the Sun or elsewhere, is still open, and Toth and Turyshev are planning to supplement their recently published review of the phenomenon with a forthcoming publication that recounts their latest work. Wolchover thinks the duo have become convinced that thermal effects aboard the spacecraft themselves are the cause of the anomaly, but Turyshev won’t reveal the results, telling the writer only, “Physics as we know it worked well.”
The review paper is Turyshev and Toth, “The Pioneer Anomaly,” published online in Living Reviews in Relativity 13 (2010).
Possible Ice Volcanoes on Titan
Two peaks more than 1000 meters tall show a topography that looks like cryovolcanism on Saturn’s moon Titan. Such an ‘ice volcano’ would evidently be fueled by subterranean geological activity that warms ice and other materials into a slush and propels it through an opening onto the surface. The site on Titan, called Sotra Facula, shows the finger-like flows one would expect from this process and does not appear to be associated with river activity that could otherwise explain the flows. Jeffrey Kargel (University of Arizona at Tucson) thinks cryovolcanism is likely:
“This is the very best evidence, by far, for volcanic topography anywhere documented on an icy satellite. It’s possible the mountains are tectonic in origin, but the interpretation of cryovolcano is a much simpler, more consistent explanation.”
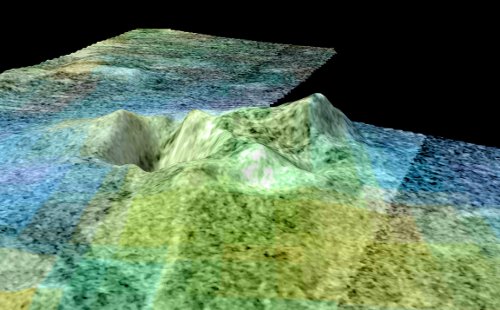
Image: Scientists believe Sotra is the best case for an ice volcano — or cryovolcano — region on Titan. The flyover shows two peaks more than 1,000 meters (3,000 feet) tall and multiple craters as deep as 1,500 meters (5,000 feet). It also shows finger-like flows. All of these are land features that indicate cryovolcanism. The 3-D topography comes from Cassini’s radar instrument. Topography has been vertically exaggerated by a factor of 10. The false color in the initial frames shows different compositions of surface material as detected by Cassini’s visual and infrared mapping spectrometer. In this color scheme, dunes tend to look relatively brown-blue. Blue suggests the presence of some exposed ice. Scientists think the bright areas have an organic coating that hides the ice and is different and lighter than the dunes. The finger-like flows appear bright yellowish-white, like the mountain and caldera. The second set of colors shows elevation, with blue being lowest and yellow and white being the highest. Dunes here appear blue because they tend to occupy low areas. The finger-like flows are harder to see in the elevation data, indicating that they are thin, maybe less than about 100 meters (300 feet) thick. Credit: NASA/JPL-Caltech/USGS/University of Arizona.
Randolph Kirk, who led the 3-D mapping work that points to this result, likens Sotra Facula to Earth volcanoes like Iceland’s Laki and Italy’s Mt. Etna. His team worked with Cassini radar images to create a topographic map, using data from Cassini’s infrared mapping spectrometer to show that the flows had a composition different from the surrounding surface. A process like this would be useful, explaining the reintroduction of methane into Titan’s atmosphere even though sunlight continues to break the molecule down. Announced at the recent American Geophysical Union meeting, Titan’s potential cryovolcanoes give us a look at yet another force shaping a landscape that offers a deep-freeze counterpoint to our own warm planet.
Echoes of an Earlier Universe
Teasing out information about previous incarnations of the universe may be the ultimate investigation for cosmologists — it’s hard to see how you go farther than into another universe, or at least, into an earlier version of this one. Roger Penrose (Oxford University) and Vahe Gurzadyan (Yerevan State University) have been much in the news since announcing last month that they had done just this, using studies of the cosmic microwave background that suggested the presence of concentric rings resulting from super-massive black hole collisions that became imprinted on the CMB. The New York Times‘ Dennis Overbye picks up the story:
The rings seen by Dr. Penrose and Dr. Gurzadyan are thin bands in which the noisy pattern of heat and cold in the early universe, as recorded by the Wilkinson satellite and other experiments, is slightly less splotchy than normal. They posted a copy of their paper on the Internet on Nov. 16, noting that the rings confirmed a prediction of a theory recently proposed by Dr. Penrose, one of the world’s distinguished mathematicians, called Conformal Cyclic Cosmology. It is the subject of a new book by him, “Cycles of Time: An Extraordinary New View of the Universe,” due out in May from Knopf.
The thrust of Overbye’s article is that criticism from other cosmologists is growing, including groups at the University of Oslo and the University of British Columbia, both of whom find the rings consistent with chance events in the earliest moments of our own universe. I’m looking forward to reading Penrose’s new book, as I’ve read all his others, but I also pay close attention to David Spergel (Princeton University), who was one of the members of the Wilkinson satellite team. Overbye quotes Spergel’s skeptical response:
“While it would have been exciting to see circles from the pre-Big Bang universe, I view this as science at its best. Exciting claims are made and they draw the attention of cosmologists throughout the world. Because the WMAP data is publicly available, groups throughout the world were able to check the claim. A universe with dark matter, dark energy and inflation is bizarre enough — we don’t, however, get to detect circles from alternative universes.”
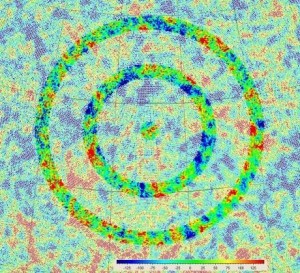
Image: The controversial rings in the cosmic microwave background, highly modified and highlighted for effect. Credit: Roger Penrose and Vahe Gurzadyan.
Now that we’ve been through the era of the Cosmic Background Explorer (COBE) and the Wilkinson Microwave Anisotropy Probe (WMAP), we’re focused on results from the European Planck satellite, which will tell us yet more about fluctuations in the microwave data. For now, the paper to look at is Gurzadyan and Penrose, “Concentric circles in WMAP data may provide evidence of violent pre-Big-Bang activity” (preprint).


Thanks for mentioning my star poster, Paul!
As for the Pioneer story, I take it to be another sorry example of “science by press release” and of the sad fact that simulations are cheaper than experiments. I believe it was Michael Martin Nieto who once proposed a purpose-built symmetrically-shaped spacecraft that could be launched to re-test the anomaly without the interference of thermal effects. NASA would have none of it and neither would ESA. Meanwhile, at least three researches have independently proposed the same quantum mechanism to explain the anomaly in terms of cosmic distortion of the Doppler radio signal (rather than physical accelerations acting on the spacecraft) which may also shed light on the earth-flyby anomalies and the so-called “A.U. anomaly” discussed by John Anderson.
Sweeping the Pioneer Anomaly under a virtual rug of presumptions may dissuade future research, but it does not to my mind constitute a satisfactory “conclusion.”
Erik:
Agreed, the study hasn’t even been published yet. Shouldn’t we at least wait until it is before we draw any conclusions? In all likelihood the cause is mundane, but declaring it solved before experimental data is even released is not a good way to do science.
I’m not entirely sure why so many people want to read new physics into the Pioneer anomaly. Such theories really need more conclusive evidence and the Pioneer probes are far from being ideal test particles. The burden should surely be on those who want to prove new physics to show that the null hypothesis that the acceleration is due to currently-known physical processes is false. As for Erik Anderson’s jab at the use of simulations, it is explicitly stated this is also including an updated set of Doppler measurements.
Roger Penrose is a great mathematician, a brilliant and wonderfully creative man who is always a joy to read. He is also increasingly and distressingly wrong. Whether it is his believe that AI is impossible because the human mind is unique in ways that cannot be duplicated by computers (what I believe is now known as the “Mysterion Hypothesis”), or that consciousness is linked to quantum gravity (how cool would that be?), or we can read traces of our prior universe(s) from patterns in the big bang, they just don’t work as either useful or even plausible hypotheses. Given the man’s obvious abilities, I am at a loss to explain why he is doing this.
There is nothing wrong with speculation, of course. If one believes that testable hypotheses are the engine of science, then speculation as a stage to developing those hypotheses makes sense and is not a bad thing. Unfortunately, what we seem to be seeing in much of his pubic work is far more metaphysics than physics. Some of his ideas may in fact, though I hesitate to say this, not be testable or so difficult to test and they await the far future for any hope of verification. While I wish him the best with his latest notion, love to be shown wrong and all that, it is a safe bet that nothing will come of it and it may be time for Penrose to forego these increasingly quixotic quests and return to the duller world of real science.
It is difficult to understand how differential spacecraft heating would result in acceleration of the entire space craft. Rotation, perhaps, but acceleration?
A friend just pointed out this to me:
http://www.greatskyatlas.com/
Pioneer Anomaly Solved By 1970s Computer Graphics Technique
A new computer model of the way heat is emitted by various parts of the Pioneer spacecraft, and reflected off others, finally solves one of the biggest mysteries in astrophysics
kfc 03/31/2011
During the last decade or so, the Pioneer Anomaly has become one of the great unsolved puzzles in astrophysics.
The problem is this. The Pioneer 10 and 11 spacecraft were launched towards Jupiter and Saturn in the early 1970s. After their respective flybys, they continued on escape trajectories out of the Solar System, both decelerating under the force of the Sun’s gravity. But careful measuremenrs show that the spacecraft are slowing faster than they ought to, as if being pulled by an extra unseen force towards the Sun.
This deceleration is tiny: just (8.74±1.33)×10^?10 ms^?2. The big question is where does it come from.
Spacecraft engineers’ first thought was that heat emitted by the spacecraft could cause exactly this kind of deceleration. But when they examined the way heat was produced on the craft, by on board plutonium, and how this must have been emitted, they were unable to make the numbers add up. At most, thermal effects could account for only 67 per cent of the deceleration, they said.
That led to a host of other ideas some of which I’ve covered in this blog. For example, last year we looked at work ruling out the possibility that gravity could be stronger at these distances, since we ought to be able to see a similar effect on the orbit of other distant objects such as Pluto.
Now Frederico Francisco at the Instituto de Plasmas e Fusao Nuclear in Lisbon Portugal, and a few pals, say they’ve worked out where the thermal calculations went wrong.
These guys have redone the calculations using a computer model of not only how the heat is emitted but how it is reflected off the various parts of the spacecraft too. The reflections turn out to be crucial.
Previous calculations have only estimated the effect of reflections. So Francisco and co used a computer modeling technique called Phong shading to work out exactly how the the emitted heat is reflected and in which direction it ends up travelling.
Phong shading was dreamt up in the 1970s and is now widely used in many rendering packages to model reflections in three dimensions. It was originally developed to handle the reflections of visible light from 3D objects but it works just as well for infrared light, say Francisco and co.
In particular, Phong shading has allowed the Portuguese team to include for the first time the effect of heat emitted from a part of the spacecraft called the main equipment compartment. It turns out that heat from the back wall of this compartment is reflected from the back of the spacecraft’s antenna (see diagram above).
Since the antenna points Sunward, towards Earth, reflections off its back would tend to decelerate the spacecraft. “The radiation from this wall will, in a ?rst iteration, re?ect off the antenna and add a contribution to the force in the direction of the sun,” say Francisco and co.
Lo and behold, this extra component of force makes all the difference. As Francisco and co put it: “With the results presented here it becomes increasingly apparent that, unless new data arises, the puzzle of the anomalous acceleration of the Pioneer probes can ?nally be put to rest.” In other words, the anomaly disappears.
Of course, other groups will want to confirm these results and a team at the Jet Propulsion Laboratory in Pasadena, which has gathered the data on the probes, is currently studying its own computer model of the thermal budgets.
It’ll be interesting to see whether they agree. If they do; problem solved. Probably!
Ref: http://arxiv.org/abs/1103.5222 Modelling The Re?ective Thermal Contribution To The Acceleration Of The Pioneer Spacecraft