Just how common are brown dwarfs? The answer is still up for debate, for stars like these (with masses less than 0.05 that of the Sun) are so small that they do not burn hydrogen, and as they age, they become more and more difficult to detect. But we’d like to know more, especially in understanding our local interstellar neighborhood. Red dwarfs are common throughout the galaxy, and we know that they can support planetary systems and even worlds in the habitable zone. Is it possible that brown dwarfs are even more numerous than red dwarfs?
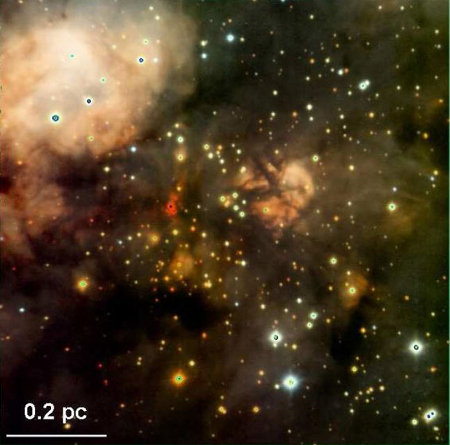
Asking questions like these takes us into what is known as the initial mass function (IMF), which involves the number of stars versus their masses at the time of their formation. The place to study the issue is a star forming region like the one shown in the image below. This Subaru Telescope composite shows the W3 Main region, about 6,000 light years away in the constellation Cassiopeia. A region like this is helpful because the majority of stars within it formed at roughly the same time, unlike a more random sampling of stars from elsewhere.

Image: Tricolor composite image of W3 Main where massive stars are being born. Red colored objects to the left of center are extremely young massive stars, surrounded by less massive stars of one million years old. Nebulae with a variety of colors and appearances are ionized gas reflecting light from these stars. Filamentary dark clouds are also conspicuous. The line at bottom left shows a scale of 0.2 parsecs, which is approximately 40 thousand astronomical units. Credit: Subaru Telescope/NAOJ.

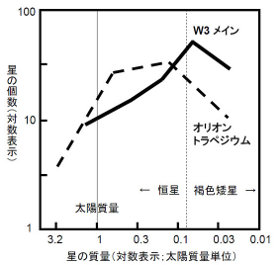
Low-mass star forming regions like Taurus may skew the broader picture, for it’s not known whether clusters of massive stars would show the same proportion of smaller stars among them. Thus the need for the Subaru study of W3 Main, which produced an image the observatory is calling “…the deepest and finest image from a ground-based telescope among the images of massive star forming regions.” The work points to a substantial number of brown dwarfs in the region. But it also finds that this distribution is significantly different from regions like the Trapezium cluster and IC 348, where a much smaller percentage of brown dwarfs have been identified in earlier studies.
Image: Stellar census showing population according to weight. The horizontal axis is the mass in the unit of the solar mass in log scale, while the vertical axis is the number of stars in log scale. In the W3 Main region (thick line), the population increases toward the less massive stars down to brown dwarf masses, indicating the abundance of the brown dwarfs in this region. Note that the turn over is in the more massive range in the Orion Trapezium cluster region. Credit: Subaru Telescope/NAOJ.
Our brown dwarf question, then, is still unanswered, but we’re making progress. This paper, which is to run in February in the Astrophysical Journal, takes our study of the initial mass function down below the hydrogen burning limit, and points to future work that will help us determine the prevalence of brown dwarfs in our galaxy. The paper is Ojha et al., “Young Brown Dwarfs in the Core of the W3 Main Star-Forming Region,” available online. A Subaru Telescope news release is also available.


We had this discussion a month or two ago. This paper backs up what some of you were saying that below about 0.07 solar masses, the prevalence of stellar objects rolls off rather quickly. This suggests that interstellar space is mostly empty, just like in the SF depictions of it.
Yeah, but is the image deep enough to pick up ‘sub-brown dwarves’ that will never burn deuterium and which might only have surface temps in the hundreds of degrees? Surely even the Subaru isnt going to reach the limiting magnitude to pick up objects in the putative ‘Y’ spectral class?
I’m not saying the brown dwarf desert doesnt exist, I’m just saying that surely its too early to tell if its Nevada or the Atacama!
P
Hi P
Nice distinction. Quite right, we don’t know yet, that’s why we’re looking. I think the current observations aren’t sensitive to planemos (free-floating planet-like objects, as opposed to brown dwarfs), but future missions will be. Will be very cool if planemos of Jupiter’s luminosity become observable, but that’s a big ask of the technology. Temperatures down to 200 K will allow a lot of young Jupiters to be spotted, if they’re nearby.
Discovery of a Wide Binary Brown Dwarf Born in Isolation
Authors: K. L. Luhman, E. E. Mamajek, P. R. Allen, A. A. Muench, D. P. Finkbeiner
(Submitted on 3 Feb 2009)
Abstract: During a survey for stars with disks in the Taurus star-forming region using the Spitzer Space Telescope, we have discovered a pair of young brown dwarfs, FU Tau A and B, in the Barnard 215 dark cloud. They have a projected angular separation of 5.7″, corresponding to 800 AU at the distance of Taurus.
To assess the nature of these two objects, we have obtained spectra of them and have constructed their spectral energy distributions. Both sources are young (~1 Myr) according to their Halpha emission, gravity-sensitive spectral features, and mid-IR excess emission. The proper motion of FU Tau A provides additional evidence of its membership in Taurus.
We measure spectral types of M7.25 and M9.25 for FU Tau A and B, respectively, which correspond to masses of ~0.05 and ~0.015 Msun according to the evolutionary models of Chabrier and Baraffe. FU Tau A is significantly overluminous relative to an isochrone passing through FU Tau B and relative to other members of Taurus near its spectral type, which may indicate that it is an unresolved binary. FU Tau A and B are likely to be components of a binary system based on the low probability (~3×10^-4) that Taurus would produce two unrelated brown dwarfs with a projected separation of a<6″.
Barnard 215 contains only one other young star and is in a remote area of Taurus, making FU Tau A and B the first spectroscopically-confirmed brown dwarfs discovered forming in isolation rather than in a stellar cluster or aggregate.
Because they were born in isolation and comprise a weakly bound binary, dynamical interactions with stars could not have played a role in their formation, and thus are not essential for the birth of brown dwarfs.
Subjects: Galaxy Astrophysics (astro-ph.GA)
Journal reference: Astrophys. J. 691 (2009) 1265-1274
Cite as: arXiv:0902.0425v1 [astro-ph.GA]
Submission history
From: Kevin Luhman [view email]
[v1] Tue, 3 Feb 2009 02:40:09 GMT (603kb)
http://arxiv.org/abs/0902.0425
Bridging the Gap Between Stars and Planets: The Formation and Early Evolution of Brown Dwarfs
Authors: Subhanjoy Mohanty, Adam Burgasser, Gilles Chabrier, Paolo Padoan, Patrick Hennebelle, Ilaria Pascucci, Adam Kraus, Isabelle Baraffe, Keivan Stassun, Jane Greaves, Ansgar Reiners, Mike Dunham, Aleks Scholz, Ben Oppenheimer, Tom Ray, Daniel Apai, Alyssa Goodman, Kelle Cruz, Louisa Rebull, Estelle Moraux
(Submitted on 13 Mar 2009 (v1), last revised 19 Mar 2009 (this version, v2))
Abstract: This White Paper, submitted to the National Academy of Sciences’ Astro2010 Decadal Review Committee, focuses on 2 central themes in the study of young brown dwarfs — their formation mechanism and disk characteristics — which are of direct relevance to fundamental questions of stellar and planetary origins and properties.
Comments: 8 pages, 3 figures, Astro2010 Science White Paper (v2 has 2 references corrected/updated, and 3 repeated references in the v1 reference list removed)
Subjects: Galaxy Astrophysics (astro-ph.GA)
Cite as: arXiv:0903.2511v2 [astro-ph.GA]
Submission history
From: Subhanjoy Mohanty [view email]
[v1] Fri, 13 Mar 2009 22:46:13 GMT (166kb)
[v2] Thu, 19 Mar 2009 17:28:51 GMT (276kb)
http://arxiv.org/abs/0903.2511
The Extreme Microlensing Event OGLE-2007-BLG-224: Terrestrial Parallax Observation of a Thick-Disk Brown Dwarf
Authors: A. Gould (Ohio State), A. Udalski (Warsaw Univ. Obs.), B. Monard (Bronberg Obs.), K. Horne (St. Andrews), Subo Dong (Ohio State), N.Miyake (Nagoya), K. Sahu (STScI), D.P. Bennett (Notre Dame), the OGLE Collaboration, MicroFUN Collaboration, RoboNet Collaboration, MOA collaboration (65 authors)
(Submitted on 1 Apr 2009)
Abstract: Parallax is the most fundamental technique to measure distances to astronomical objects. Although terrestrial parallax was pioneered over 2000 years ago by Hipparchus (ca. 140 BCE) to measure the distance to the Moon, the baseline of the Earth is so small that terrestrial parallax can generally only be applied to objects in the Solar System.
However, there exists a class of extreme gravitational microlensing events in which the effects of terrestrial parallax can be readily detected and so permit the measurement of the distance, mass, and transverse velocity of the lens.
Here we report observations of the first such extreme microlensing event OGLE-2007-BLG-224, from which we infer that the lens is a brown dwarf of mass M=0.056 +- 0.004 Msun, with a distance of 525 +- 40 pc and a transverse velocity of 113 +- 21 km/s. The velocity places the lens in the thick disk, making this the lowest-mass thick-disk brown dwarf detected so far.
Follow-up observations may allow one to observe the light from the brown dwarf itself, thus serving as an important constraint for evolutionary models of these objects and potentially opening a new window on sub-stellar objects.
The low a priori probability of detecting a thick-disk brown dwarf in this event, when combined with additional evidence from other observations, suggests that old substellar objects may be more common than previously assumed.
Comments: submitted to ApJ Letters, 13 pages including 2 figures. Full resolution at this http URL
Subjects: Galaxy Astrophysics (astro-ph.GA)
Cite as: arXiv:0904.0249v1 [astro-ph.GA]
Submission history
From: Andrew Gould [view email]
[v1] Wed, 1 Apr 2009 20:00:03 GMT (214kb)
http://arxiv.org/abs/0904.0249