Back in the late 1970s I didn’t know anything about star catalogs. I suppose that, if asked, I would have assumed they were out there — how otherwise could astronomers do their jobs? But the first catalog of stars that came into my life emerged when I was writing an article about SETI, a field I developed an intense interest in and at that time knew very little about. For the article I needed to identify the closest stars, and thus I stumbled upon the Gliese Catalog of Nearby Stars, and over the course of time became absorbed by the idea of exoplanets.
In many ways my first dip into the Gliese catalog began the journey that continues here, because that first SETI article was the forerunner of the kind of writing I have been doing since the turn of the century. In that time our catalogs have grown more and more interesting to me, but none can match today’s, the all-sky view of almost 1.7 billion stars that is the result of the European Space Agency’s Gaia mission. The second Gaia data release became available on April 25 and includes parallax, proper motion and color data for more than 1.3 billion of these stars.
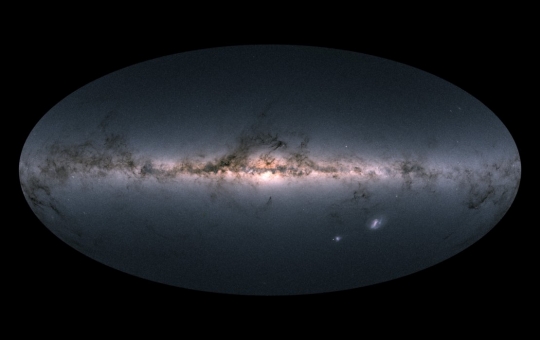
Image: Gaia’s all-sky view of our Milky Way Galaxy and neighbouring galaxies, based on measurements of nearly 1.7 billion stars. The map shows the total brightness and colour of stars observed by the ESA satellite in each portion of the sky between July 2014 and May 2016. Brighter regions indicate denser concentrations of especially bright stars, while darker regions correspond to patches of the sky where fewer bright stars are observed. The colour representation is obtained by combining the total amount of light with the amount of blue and red light recorded by Gaia in each patch of the sky. The bright horizontal structure that dominates the image is the Galactic plane, the flattened disc that hosts most of the stars in our home Galaxy. In the middle of the image, the Galactic centre appears vivid and teeming with stars. Credit: ESA.
You might note the two bright objects at lower right. These are the Large and Small Magellanic clouds, two of the dwarf galaxies that orbit the Milky Way. Note as well the darker regions along the galactic plane, clouds of interstellar dust that hide the light of stars behind and within them, some serving as the breeding ground for young stars.
This is the richest star catalog yet produced, based on 22 months of observation. Gaia, says ESA director of science Günther Hasinger, is “redefining the foundations of astronomy.” And he adds:
“Gaia is an ambitious mission that relies on a huge human collaboration to make sense of a large volume of highly complex data. It demonstrates the need for long-term projects to guarantee progress in space science and technology and to implement even more daring scientific missions of the coming decades.”
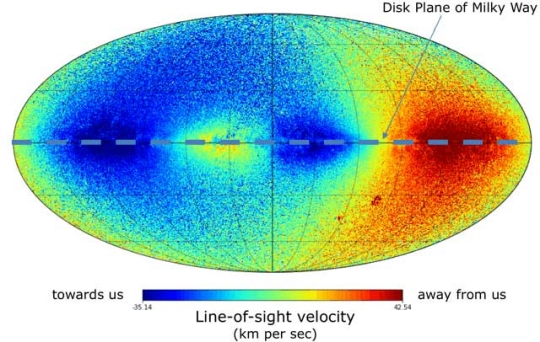
Image: The all-sky map of median velocities of stars towards or away from the Sun. The large scale pattern caused by rotation of our Galaxy is evident. Credit: DPAC/ESA.
We’ve had quite a jump here, moving from the first data release, published in 2016, and containing the distances and motions of 2 million stars, to today’s 1.7 billion. ESA is saying that the new release identifies the positions of some of the brightest stars in the field to the same level of precision as Earth observers would need to spot a coin on the surface of the Moon. We achieve estimated distances to individual stars for about ten percent of the total catalog.
A news release from the Science & Technology Facilities Council (UK) surveys what’s available:
This second data release allows progress in all these studies by providing not only distances and apparent motions across the sky for 1.3 billion sources, but also very precise measurements of brightness and colour for an even larger catalogue of 1.7 billion sources. Seven million stars have their line of sight velocities measured, providing full 6-dimensional – three space positions, 3 space motions – information, determining full orbits for those stars in the Milky Way. This is the information needed to weigh the Galaxy, and determine the distribution – and perhaps the properties – of Dark Matter, the mysterious substance which dominates the mass of the Galaxy and the Universe. Credit: Science & Technology Facilities Council’s (STFC) Rutherford Appleton Laboratory, UK.
Out of Gaia comes a refined version of the Hertzsprung-Russell diagram, an essential tool relating stellar intrinsic brightness to color that helps us make sense of the evolution of stars. Gaia offers data on four million stars within 5,000 light years of the Sun, revealing fine-grained details in the traditional H-R plot, including differing signatures for white dwarfs with hydrogen-rich and helium-rich cores, and the ability to distinguish between disk and halo stars. The orbits of 75 globular clusters and 12 dwarf galaxies around the Milky Way can likewise be derived.
“The new Gaia data are so powerful that exciting results are just jumping at us,” says Antonella Vallenari from the Istituto Nazionale di Astrofisica (INAF) and the Astronomical Observatory of Padua, Italy, deputy chair of the data processing consortium executive board. [W]e have built the most detailed Hertzsprung-Russell diagram of stars ever made on the full sky and we can already spot some interesting trends. It feels like we are inaugurating a new era of Galactic archaeology.”
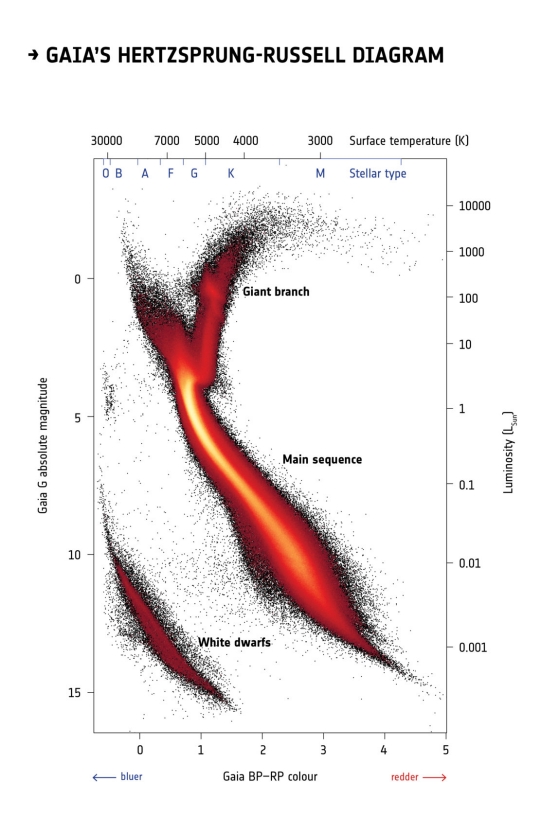
Image: Named after the two astronomers who devised it in the early twentieth century, the Hertzsprung-Russell diagram compares the intrinsic brightness of stars with their colour and is a fundamental tool to study populations of stars and their evolution. Credit: ESA.
Papers on the second Gaia data release appear in a special issue of Astronomy & Astrophysics, while numerous video and virtual reality resources are available here. As we look forward to abundant discoveries from the current release, it’s worth remembering that the final Gaia catalog will not be published until the 2020s. The five-year Gaia mission has been approved for extension until the end of 2020. Gaia’s 3-dimensional map of our galaxy shows 600 times more stars than previously available and covers a volume 1,000 times larger than the first Gaia data release, with a precision 100 times larger. It is hard to imagine any area of astrophysical research that will not be advanced by the availability of these data.
And I have to add this coda: Star catalogs, after all these years, still astound me. I think that’s because the sheer scale of things is so astonishing. After all, the massive Gaia haul at this point reaches 1.7 billion stars, out of a galaxy made up of perhaps 200 billion, in a universe of galaxies whose true extent we are still trying to fathom. Our cataloging species has only begun its immense task.


I would like them use the same bus system and in several years launch another one but with improved optics and controls so to keep the costs down.
Actually there is a follow up project called GaiaNIR which will have another band in the NIR. Right now it is on the conceptual stage but there have been presentations on it, usually the last ones at Gaia conferences
Would you have a link by any chance?
hi there,
an one year old presentation is here :
https://iaus330.sciencesconf.org/data/pages/Hobbs_Mac_Acrobat_web.pdf
About four and a half decades ago gas stations gave away a variety of road maps for free, and (New York) subway stations gave away route maps for free. To some folks this might feel like a return to those days. On a vastly grander scale.
Isaac Arthur’s latest Yuotube post on Alien Beacons seems an appropriate one for the event:
https://youtu.be/DHoOjIEcRV8
Public transit systems in a lot of places still operate on that “give away the maps” principle.
As for this being on a grander scale? I’d agree.
Congratulations to the GAIA team on this milestone!
While mapping the cosmos is certainly a worthwhile endeavor, I wonder how much value it will be for celestial navigation, if you’re talking about space probes that must wander perhaps hundreds of light years into outer space.
Specifically, the ephemeris that is stated for planetary bodies (and other celestial bodies) always refers to a specific epoch for their particular reference in time. As I understand it, that’s because of the relative motions of the bodies in question, which necessitates recalibrating the particular choice of years against which you are referring the observations to.
As a result of all this, and especially because of the fact that these celestial bodies are of such great distance, and has such great uncertainties in their proper motions, I wonder if this is more of a work in progress, rather than a final compilation. Any thoughts on this by others?
Charley writes “I wonder how much value it will be for celestial navigation.”
Truly I have progressed not a single step beyond magical fascination with the wonder of this crazy universe we find ourselves inhabiting.
On the one hand I yearn for a complete and deeper understanding; on the other hand, my own childish wonder brings its own satisfaction.
I wonder whether Planet 9 lurks in this data.
Among the stars of DR2? No. In the Gaia data? Yes. Solar System objects are originally intended for DR5. The 14,099 known asteroids were moved early, likely because the pipeline could pull them out easily. On DR5 they will have new solar system objects, so if Gaia detects Planet 9 or 10, it will be there. Now, if they could pull it forward to an earlier release …
I was thinking more in the lines of raw images (or portions of images, actually) available for public inspection, like in the NEOWISE project, but thanks for the information about DR5.
If we know the spectral type of the star we can determine it’s distance if it is in a star cluster which is pretty accurate. I notice some of the G and K class stars have moved off the main sequence hydrogen burning into the giant branch. Our telescopes of the future can look at the G class on the main sequence at one luminosity for an Earth twin.
The Parallax shift is used to determine the distance of stars which are close to us and the use of a standard candle like a Cepheid variable star and type 1A supernova which their absolute luminosity can be determined accurately thus indicates the distance of distant stars.
The luminosity of light follow the inverse square law which attenuates over distance allowing astronomers to calculate the distance of the star. The atomic physics of the type one A supernova’s absolute brightness is known and based on a narrow range of mass for the chandrasekhar limit.
My first exposure to star catalogs came when I read Winchell Chung’s page on making 3-D Starmaps, for which star catalog data is absolutely required. This triggered my desire to write my own computer program to sift through and display nearby stars in 3-D, encouraging me to begin programming (but that’s another story).
This new Gaia data release is very exciting, since it extends well beyond the scope and precision of previous catalogs like the Gliese Catalog. This will certainly have a big impact on astronomy for years to come.
Particularly exciting to me is the fact that Gaia provides accurate distance and velocity data for a much wider set of stars, allowing for ever larger and more accurate 3D visualizations of the stars. I think that even today, many people fall into thinking of the stars as functionally equivalent to unmoving objects affixed to the (imaginary) celestial sphere, since this is how the sky looks to us (and also how 2D starcharts portray them). A 3D starmap brings home that the stars are actually surrounding Earth in 3D space, making them seem all the more real as places we (or our technology) could potentially visit.
I’ve turned to this website frequently because Paul offers for cogent explanations of some mighty difficult subjects. And today’s discussion reminds me of a topic that could benefit from the “Gilster Touch”: making sense of these data mountains.
So many questions! How is the data obtained, in initial form? Where does it go? How are stars ‘tagged’? What sorts of algorithms, and underlying assumptions, are needed to bring this image to life? What sort of computing power, for instance?
An internet-friend of mine (this being an entirely 21st century turn of phrase!), having very high level access and responsibility in the Cassini project, has reminded me time and again of the sheer mass of collected data: the realities of countless hard-drives, the types of computations needed, etc. And here we have a project that dwarfs even Cassini.
It is a great time to be alive.
If I can swing it, Michael, I may be able to get a member of the Gaia team to handle these questions. Will do my best!
Michael, ESA’s ESA’s Jos de Bruijne has kindly replied to your questions. He is a Gaia Deputy Project Scientist, and I’ll reprint his complete answer below. Many thanks to Dr. de Bruijne for taking the time to describe Gaia operations!
——-
Thanks for your enthusiasm in covering Gaia’s second data release. Your friend’s questions are good ones but not easy to answer in a sentence or two. But I’ll try …
Gaia is a scanning mission. It continuously scans the heavens and sees, over the course of its five-year life, each of the ~2 billion objects about 70 times. By putting the 70 data points collected over the five years next to each other, the motion and parallax (distance) pattern become apparent and can be fitted for. The spacecraft uses two telescopes, each roughly 1.5 m in size, and a digital camera with nearly 1 billion pixels. When an object comes in the field of view, it gets detected and a small image (a little postage stamp surrounding the object) is sent to the ground for further analysis. This trick is needed to make the volume of the data stream from space to ground manageable.
More information can be found in https://ui.adsabs.harvard.edu/#abs/2016A%26A…595A…1G
Where does it go?
The data gets sent from the spacecraft to one of the three ESA ground stations (35-m radio dishes) in Cebreros (Spain), New Norcia (Australia), or Malargüe (Argentina); these constitute ESA’s Deep Space Network. From there, the data is sent to the ESA Mission Control Centre in Darmstadt, Germany. From there, the science data is sent to the ESA Science Operations Centre near Madrid, Spain. Some of the key processing is done there. Some other processing is done in five other data processing centres, in Barcelona, Toulouse, Torino, Geneva, and Cambridge (UK).
How are stars ‘tagged’?
Gaia itself does not know which star is which and only detects specks of light. The little postage stamps containing the star images get sent to the ground; with the image comes the precise time of detection, which is key to determining where the stars are in the sky (Gaia actually uses an atomic clock since the time of detection needs to be known with ultra-high precision). On ground, the real tagging and identification takes place.
What sorts of algorithms, and underlying assumptions, are needed to bring this image to life?
The key algorithms used for Gaia DR2 are explained in https://arxiv.org/abs/1804.09366. The Gaia data processing is a complex undertaking and has been entrusted to a consortium of specialists, organised in the Gaia Data Processing and Analysis Consortium (DPAC). More details are here: https://www.cosmos.esa.int/web/gaia/dpac and https://gea.esac.esa.int/archive/documentation/GDR2/Introduction/chap_cu0int/cu0int_sec_dpac/
What sort of computing power, for instance?”
Some details are listed here: https://gea.esac.esa.int/archive/documentation/GDR2/Introduction/chap_cu0int/cu0int_sec_release_framework/cu0int_ssec_processing_configuration.html
The challenge of the data processing lies in the volume of the data, its complexity, and its inter dependency. The estimate is that, for Gaia DR4, some 1E21 floating-point operations will be needed (1000 million million million subtractions, additions, divisions, or multiplications).
I hope this helps a little.
Jos de Bruijne
Gaia Deputy Project Scientist
European Space Agency
So how close does this say Gilese 710 will get to Earth now?
Any updates regarding the Pleiades distance controversy? Is it still present in the DR2 dataset?
Not sure about the Pleiades, but will report when I learn something on this.
According to Jason Wright, that was ALREADY SETTLED with GaiaDR1! Pre-Hipparcos values consistant with DR1 value and Hipparcos was WAY OFF for some reason.
Pulling DR2 parallax data from Vizier, I ran the numbers on the 10 brightest Pleiads, and they show a puzzling spread of distances between 105.5 pc (Maia and Merope) to 136.1 pc (Asterope). A line-of-sight spread of 30 pc for a cluster that’s only 4 pc wide? What am I missing?
Okay, I think I’ve solved(?) my puzzle.
I downloaded all the DR2 targets matching the Pleiades membership criteria listed in the DR1 paper which addresses the distance controversy (https://www.aanda.org/articles/aa/pdf/2016/11/aa29512-16.pdf). There are 1689 candidate Pleiads (including a couple dozen field stars which coincidentally share similar proper motions with true cluster members). The rest show a classic Gaussian distribution around parallaxes of about 7.5 mas (in good agreement with the much smaller DR1 data set), and a spread of distances ranging roughly from 110 to 160 pc. Wikipedia lists the tidal radius of the cluster as “about 43 LY” (i.e. a diameter of 26 pc), so that still makes for a roughly 90% elongation of the cluster along the line of sight (or a flattening parameter of around 0.5).
The reference Wikipedia cites for the tidal radius (http://iopscience.iop.org/article/10.1086/319965/pdf) points out that galactic tidal forces tend to elongate clusters in the galactic radial direction, which (given the Pleiades’ location, fairly near the galactic anticenter) would perhaps make sense. This paper (http://iopscience.iop.org/article/10.1086/424855/pdf) lists shapes for 31 open clusters with flattening parameters up to 0.5, so perhaps the Pleiades are just a relatively elongated cluster compared to most.
The DR1 data did not solve the problem of the Pleiades distances – to quote from the paper referenced below ‘We want to emphasise that, taking this systematic uncer-tainty into account, Gaia DR1 cannot be considered as giving a final and definite answer on the so-called Pleiades distance discrepancy. In particular an explanation for the discrepancy between Gaia DR1 and Hipparcos cannot be provided at this
stage.’
Since the same difference does not ocour in the Hipparcos data for the nearby Hyades it is still not clear why the differences exist. One thing to bear in mind is Hipparcos being less sensitive than Gaia measured some stars that are too bright for Gaia such as the bright stars in the Pleiades, it is not clear if this has any impact on the discrepancy.
Can someone point me to information that explains the structure depicted in the first image? I’m guessing that the data shows the effect of looking towards the galactic center as well as outwards. Is our spiral arm, or others, discernible in the image?
Here is the caption as given in the introductory paper/press release (https://www.aanda.org/articles/aa/pdf/forth/aa33051-18.pdf)
Fig. 4. Map of the total flux measured in the GRP, G, and GBP bands, where the flux in these bands is encoded in the red, green, and blue channel, respectively. There is one easily visible artefact in this map, a ‘green’ patch to the lower left of the bulge which is a region where GBP and GRP data are not available for a large number of sources, leading to the greenish colour which was used to encode the G-band fluxes (which are available for all sources). Such artefacts also occur (although not as visible) in the region to the upper left of the Small Magellanic Cloud and at high Galactic latitude to the right of the north Galactic pole region. The areas where green patches are likely to occur can be identified in Figure 27 in Evans et al. (2018) which shows the celestial distribution of Gaia DR2 sources for which no BP/RP photometry is available.
The first image is based on the doppler shift of light from stars which reveal the rotation of the galaxy. The light waves are stretched to a longer wavelength into the red spectrum since the stars velocity are moving away on the right side of the galaxy us and the left side stars are moving towards us which shortens the wavelength of light into the blue spectrum or is blue shifted. https://www.youtube.com/watch?v=Bx0SMevn-0c
What might that little ‘tail’ to the left it the middle of the white dwarf branch represent I wonder?
I especially love the view of the LMC in the monochrome version. Some real spiral structure there.
P
Perhaps those are the renewed ones, who got or still get matter falling onto them so they get more energy – bluer.
I wonder about the clump near the number 5 at left, very blue but not very bright, Wolf-Rayet stars?
GAIADR2 2635476908753563008 – TRAPPIST-1 parallax 80.4512 microarcseconds versus the ACCEPTED VALUE of 82.4 +/- 0.8 mas. This means that TRAPPIST-1 is a little bit farther away than previously thought! Therefore the star must be a little bit more luminous than the current figures indicate. May be bad news for TRAPPIST-1d(more LIKELY to be a steamworld). GREAT news for TRAPPIST-1e. Very close now to Earth-like temperature. May help TRAPPIST-1f a bit(Eyball Earth now a POSSIBILITY). No real change for the remaining planets.
Sorry, I meant “Eyeball”, NOT “Eyball”.
What is an Eyeball Earth exactly?
Rather than trying to describe it with words, just google TRAPPIST-1, click the top entry on the list page, click “system”, and you will see an image of TRAPPIST-1f that looks remarkably like an eyeball, with the ocean corresponding to the iris, and the ice sheet corresponding to the white part of the cornea.
You need to consider the error quoted in the DR2 catalogue and add the systematic and offset errors as well. See the presentation on astrometry for scientists on the Gaia DR2 web site. It does not get too scary till the discussion of the need for using baysian statistics to consider the impact of the errors. Also interesting information on biases caused by selection effects resulting from rejecting stars with negative parallaxes or high levels of errors relative to the parallax. A good example is given for quasars that should have near zero parallax but if you reject those with negative parallax you end up with a skewed distribution and a mean that is not the true mean.
I wonder if some rather important values provided by Gaia could indeed be errors. For example, it gives Delta Pavonis’ luminosity as 1.51 (against 1.22), absolute magnitude as 4.338 (versus 4.621), apparent magnitude as 3.263 (in contrast to 3.55/56), radius of 1.64 (versus 1.22). And Tau Ceti gets higher absolute magnitude as well (5.348 versus 5.69), plus radius 0.86 versus 0.79. Similar situation with a few other stellar objects (judging by a passing glance).
Gaia Sky must not be sure itself because it doubles some stars – visually putting the “Gaian” model next to the “original” one. It looks like new binary systems.
Globular clusters 4 billion years younger than previously thought
https://warwick.ac.uk/newsandevents/pressreleases/globular_clusters_4/
Once thought to be formed soon after the Universe itself, new research finds Globular Clusters may be only around 9 billion years old.
Globular clusters age revised following research into the age of binary star systems within the clusters, with both thought to have been born at the same time.
Findings may change understanding of how the Milky Way and similar galaxies formed, with well over 100 Globular Clusters known to exist within the galaxy.
New models uncovered that old stellar populations may be significantly less ancient than previously thought, according to lead researcher Dr Elizabeth Stanway of the University of Warwick.
So has Gaia’s new data shown that Parenago’s Discontinuity is a galaxy-wide phenomenon?
See here:
https://centauri-dreams.org/2015/09/18/greg-matloff-conscious-stars-revisited/