Centauri Dreams
Imagining and Planning Interstellar Exploration
Shelter from the Storm
The approaching storm will almost certainly cause power outages that will make it impossible to post here. If this occurs, you can be sure that I’ll get any incoming messages posted as soon as I can get back online. Please continue to post comments as usual and let’s cross our fingers that the storm is less dangerous than it appears.
Cellular Cosmic Isolation: When the Universe Seeds Life but Civilizations Stay Silent
So many answers to the Fermi question have been offered that we have a veritable bestiary of solutions, each trying to explain why we have yet to encounter extraterrestrials. I like Leo Szilard’s answer the best: “They are among us, and we call them Hungarians.” That one has a pedigree that I’ll explore in a future post (and remember that Szilard was himself Hungarian). But given our paucity of data, what can we make of Fermi’s question in the light of the latest exoplanet findings? Eduardo Carmona today explores with admirable clarity a low-drama but plausible scenario. Eduardo teaches film and digital media at Loyola Marymount University and California State University Dominguez Hills. His work explores the intersection of scientific concepts and cinematic storytelling. This essay is adapted from a longer treatment that will form the conceptual basis for a science fiction film currently in development. Contact Information: Email: eduardo.carmona@lmu.edu
by Eduardo Carmona MFA

In September 2023, NASA’s OSIRIS-REx spacecraft delivered a precious cargo from asteroid Bennu: pristine samples containing ribose, glucose, nucleobases, and amino acids—the molecular Lego blocks of life itself. Just months later, in early 2024, the Breakthrough Listen initiative reported null results from their most comprehensive search yet: 97 nearby galaxies across 1-11 GHz, with no compelling technosignatures detected.
We live in a cosmos that generously distributes life’s ingredients while maintaining an eerie radio silence. This is the modern Fermi Paradox in stark relief: building blocks everywhere, conversations nowhere.
What if both observations are telling us the same story—just from different chapters?
The Seeding Paradox
The discovery of complex organic molecules on Bennu—a pristine carbonaceous asteroid that has barely changed in 4.5 billion years—confirms what astrobiologists have long suspected: the universe is in the business of making life’s components. Ribose, the sugar backbone of RNA. Nucleobases that encode genetic information. Amino acids that fold into proteins.
These aren’t laboratory curiosities. They’re delivered at scale across the cosmos, frozen in time capsules of rock and ice, raining down on every rocky world in every stellar system. The implications are profound: prebiotic chemistry isn’t a lottery. It’s standard operating procedure for the universe.
This abundance makes the silence more puzzling. If life’s ingredients are everywhere, why isn’t life—or at least communicative life—equally ubiquitous? The Drake Equation suggests we should be drowning in signals. Yet decade after decade of increasingly sophisticated SETI searches return the same answer: nothing.
The traditional responses—they’re too far away, they use technology we can’t detect, they’re deliberately hiding—feel increasingly like special pleading. What if the answer is simpler, more systemic, and reconcilable with both observations?
Cellular Cosmic Isolation: A Synthesis
I propose what I call Cellular Cosmic Isolation (CCI)—not a single explanation but a framework that synthesizes multiple constraints into a coherent picture. Think of it as a series of filters, each one narrowing the funnel from chemical abundance to electromagnetic chatter.
The framework rests on four interlocking observations:
1. Prebiotic abundance: Chemistry is generous. Small bodies deliver life’s building blocks widely and consistently. Biospheres may be common.
2. Geological bottlenecks: Complex, communicative life requires rare conditions—specifically, worlds with coexisting continents and oceans, sustained by long-duration plate tectonics (≥500 million years). Earth’s particular geological engine may be uncommon.
3. Fleeting windows: Technological civilizations may have extraordinarily brief outward-detectable phases—measured in decades, not millennia—before transitioning to post-biological forms, self-destruction, or simply turning their attention inward.
4. Communication constraints: Physical limits (finite speed of light, signal dispersion, beaming requirements) plus coordination problems suppress even the detection of civilizations that do exist.
The result? A universe where the chemistry of life is ubiquitous, simple biospheres may be common, but detectable technospheres remain vanishingly rare and non-overlapping in spacetime. We’re not alone because life is impossible. We’re alone because the path from ribose to radio telescopes has far more gates than we imagined.
The Geological Filter: Earth’s Unlikely Engine
This is perhaps CCI’s most counterintuitive claim, yet it’s grounded in recent research. In a 2024 paper in Scientific Reports, planetary scientists Robert Stern and Taras Gerya argue that Earth’s specific combination—plate tectonics that has operated for billions of years, creating and recycling continents alongside persistent oceans—may be geologically unusual.
Why does this matter for intelligence? Because continents enable:
• Terrestrial ecosystems with high energy density and environmental diversity
• Land-ocean boundaries that create evolutionary pressure for complex sensing and locomotion
• Fire (impossible underwater), which enables metallurgy and advanced tool use
• Seasonal and altitudinal variation that rewards cognitive flexibility
Venus has no plate tectonics. Mars lost its early tectonics. Europa and Enceladus have subsurface oceans but no continents. Earth’s geological engine—stable enough to persist for billions of years, dynamic enough to continuously create new land and recycle old—may be a rare configuration.
Mathematically, this adds two probability terms to the Drake Equation: foc (the fraction of habitable worlds with coexisting oceans and continents) and fpt (the fraction with sustained plate tectonics). If each is, say, 0.1-0.2, their joint probability becomes 0.01-0.04—already a significant filter.
The Temporal Filter: Civilization’s Brief Bloom
But the most devastating filter may be temporal. Traditional SETI assumes civilizations remain detectably technological for thousands or millions of years. CCI suggests the opposite: the phase during which a civilization broadcasts electromagnetic signals into space may be extraordinarily brief—perhaps only decades to centuries.
Consider the human trajectory. We’ve been radio-loud for roughly a century. But already:
• We’re transitioning from broadcast to narrowcast (cable, fiber, satellites)
• Our strongest signals are becoming more controlled and directional
• We’re developing AI systems that may fundamentally transform human civilization within this century
What comes after? Post-biological intelligence operating at computational speeds? A civilization that turns inward, exploring virtual realities? Self-annihilation? Deliberate silence to avoid dangerous contact?
We don’t know. But if the detectable technological phase (call it Lext) averages 50-200 years rather than 10,000-1,000,000 years, the probability of temporal overlap collapses. In a galaxy 13 billion years old, two civilizations with century-long detection windows need to be synchronized to within a cosmic eyeblink.
This isn’t speculation—it’s extrapolation from our own accelerating technological trajectory. And acceleration may be a universal property of technological intelligence.
The Mathematics of Solitude
The traditional Drake Equation multiplies probabilities: star formation rate × fraction with planets × habitable planets per system × fraction developing life × fraction developing intelligence × fraction developing communication × longevity of civilization.
CCI expands this with additional constraints:
Ndetectable = R* × Tgal × [biological/technological terms] × [foc × fpt] × [Lext / Tgal] × C(I)
Where C(I) captures propagation physics—distance, dispersion, scattering, beaming geometry. Each term is a probability distribution, not a point estimate.
In 2018, Oxford researchers Anders Sandberg, Stuart Armstrong, and Milan Ćirković performed a rigorous Bayesian analysis of Drake’s Equation using probability distributions for each parameter. Their conclusion? When uncertainties are properly handled, the probability that we are alone in the observable universe is substantial—not because life is impossible, but because the error bars are enormous.
CCI takes this Bayesian framework and adds the geological and temporal constraints. The result: a posterior probability distribution that is entirely consistent with both abundant prebiotic chemistry and persistent SETI nulls. No paradox required.
What We Should See (And Why We Don’t)
CCI makes testable predictions. If the framework is correct:
1. Biosignatures before technosignatures
Upcoming missions like the Habitable Worlds Observatory should detect atmospheric biosignatures (oxygen-methane disequilibria, possible vegetation edges) before detecting techno signatures. Simple biospheres should be discoverable; technospheres should remain elusive.
2. Continued SETI nulls
Radio and optical SETI campaigns will continue to find nothing—not because we’re searching wrong, but because the detectable population is genuinely sparse and temporally fleeting.
3. Technosignature detection requires extreme investment
Detection of artificial spectral edges (like photovoltaic arrays reflecting at silicon’s UV-visible cutoff) or Dyson-sphere waste heat requires hundreds of hours of observation time even for nearby stars. Their absence at practical survey depths is predicted, not puzzling.
Importantly, CCI is falsifiable. A single unambiguous, repeatable interstellar signal would invalidate the short-Lext assumption. Multiple detections of artificial spectral features would refute the geological filter. The framework lives or dies by observation.
The Cosmos as Organism
There’s an almost biological elegance to this picture. The universe manufactures prebiotic molecules in stellar nurseries and delivers them via comets and asteroids—a kind of cosmic panspermia that doesn’t require directed intelligence, just chemistry and gravity. Call it the seeding phase.
Some of those seeds land on worlds with the right geological configuration—the awakening phase—where continents and oceans coexist long enough for complex cognition to emerge. This is rarer.
A tiny fraction of those awakenings reaches technological sophistication—the communicative phase—but this phase is fleeting, measured in decades to centuries before transformation or silence. This is rarest.
And even then, physical constraints—distance, timing, beaming, the sheer improbability of coordination—suppress detection. The isolation phase.
The cosmos isn’t hostile to intelligence. It’s just structured in a way that makes electromagnetic conversation between civilizations vanishingly unlikely—not impossible, just so improbable that null results after decades of searching are exactly what we’d expect.
Each civilization, then, is like a cell in a vast organism: seeded with the same chemical building blocks, developing according to local conditions, briefly active, then transforming or falling silent before contact with other cells occurs. Cellular Cosmic Isolation.
What This Means for Us
If CCI is correct, we should recalibrate our expectations without abandoning hope. SETI is not futile—it’s hunting for an extraordinarily rare phenomenon. Every null result tightens our probabilistic constraints and guides future searches. But we should also prepare for the possibility that we are, if not alone, then at least effectively alone during our detectable window.
This shifts the weight of responsibility. If technological civilizations are rare and fleeting, then ours carries unique value—not as a recipient of cosmic wisdom from older civilizations, but as a brief, precious experiment in consciousness. The burden falls on us to use our detectable phase wisely: to either extend it, transform it into something sustainable, or at least ensure we don’t waste it.
The universe seeds life generously. It’s indifferent to whether those seeds grow into forests or fade into silence. CCI suggests that the path from chemistry to conversation is longer, stranger, and more filtered than we imagined.
But the building blocks are everywhere. The recipe is universal. And somewhere, in the vast probabilistic landscape of possibility, other cells are awakening. We just may never hear them call out before they, like us, transform into something we wouldn’t recognize as a civilization at all.
That is not a paradox. That is simply the way the cosmos works.
Further Reading
Prebiotic Chemistry:
Furukawa, Y., et al. (2025). “Detection of sugars and nucleobases in asteroid Ryugu samples.” Nature Geoscience. NASA’s OSIRIS-REx mission (2023) also reported similar findings from Bennu.
Bayesian Drake Analysis:
Sandberg, A., Drexler, E., & Ord, T. (2018). “Dissolving the Fermi Paradox.” arXiv:1806.02404. Oxford Future of Humanity Institute.
Geological Filters:
Stern, R., & Gerya, T. (2024). “Plate tectonics and the evolution of continental crust: A rare Earth perspective.” Scientific Reports, 14.
SETI Null Results:
Choza, C., et al. (2024). “A 1-11 GHz Search for Radio Techno signatures from the Galactic Center.” Astronomical Journal. Breakthrough Listen campaign results.
Barrett, J., et al. (2025). “An Exoplanet Transit Search for Radio Techno signatures.” Publications of the Astronomical Society of Australia.
Technosignature Detection:
Lingam, M., & Loeb, A. (2017). “Natural and Artificial Spectral Edges in Exoplanets.” Monthly Notices of the Royal Astronomical Society Letters, 470(1), L82-L86.
Kopparapu, R., et al. (2024). “Detectability of Solar Panels as a Techno signature.” Astrophysical Journal.
Wright, J. et al (2022). “The Case for Techno signatures: Why They May Be Abundant, Long-lived, and Unambiguous.” The Astrophysical Journal Letters 927(2), L30.
Technology Acceleration:
Garrett, M. (2025). “The longevity of radio-emitting civilizations and implications for SETI.” Journal of the British Interplanetary Society (forthcoming). See also earlier work on technological singularities and post-biological transitions.
Pandora: Exoplanets at Multiple Wavelengths

Sometimes we forget how overloaded our observatories are, both in space and on the ground. Why not, for example, use the James Webb Space Telescope to dig even further into TRAPPIST-1’s seven planets, or examine that most tantalizing Earth-mass planet around Proxima Centauri? Myriad targets suggest themselves for an instrument like this. The problem is that priceless assets like JWST not only have other observational goals, but more tellingly, any space telescope is overbooked by scientists with approved observing programs.
Add to this the problem of potentially misleading noise in our data. Thus the significance of Pandora, lofted into orbit via a SpaceX Falcon 9 on January 11, and now successful in returning robust signals to mission controllers. One way to take the heat off overburdened instruments is to create much smaller, highly specialized spacecraft that can serve as valuable adjuncts. With Pandora we have a platform that will monitor a host star in visible light while also collecting data in the near infrared from exoplanets in orbit around it.
Image: A SpaceX Falcon 9 rocket carrying NASA’s Pandora small satellite, the Star-Planet Activity Research CubeSat (SPARCS), and Black Hole Coded Aperture Telescope (BlackCAT) CubeSat lifts off from Space Launch Complex 4 East at Vandenberg Space Force Base in California on Sunday, Jan. 11, 2026. Pandora will provide an in-depth study of at least 20 known planets orbiting distant stars to determine the composition of their atmospheres — especially the presence of hazes, clouds, and water vapor. Credit: SpaceX.
We can use transmission spectography to study an exoplanet’s atmosphere, providing it transits the host star. In that case, the data taken when the planet transits the stellar disk can be compared to data when the planet is out of view, so that chemicals in the atmosphere become apparent. This method works and has been used to great effect with a number of transiting hot Jupiters. But contamination of the result caused by the star itself remains a problem as we widen our observations to ever smaller worlds.
Dániel Apai (University of Arizona) and colleagues have been digging into this problem for a number of years now. Apai is co-investigator on the Pandora mission. He refers to “the transit light source effect” one which he has been working on since 2018. Apai put it this way in an article in the Tucson Sentinel:
“We built Pandora to shatter a barrier – to understand and remove a source of noise in the data – that limits our ability to study small exoplanets in detail and search for life on them.”

The multiwavelength aspect of Pandora is crucial for its mission. The goal is to separate exoplanet signatures from stellar activity that can mimic or even suppress our readings on compounds within the planetary atmosphere. Pandora will examine a minimum of 20 already identified exoplanets and their host stars (some of these were TESS discoveries). Each target system will be observed 10 times for 24 hours at a time. Starspots and other stellar activity can then be subtracted from the near-infrared readings on clouds, hazes and other atmospheric components.
Image: The Pandora observatory shown with the solar array deployed. Pandora is designed to be launched as a ride-share attached to an ESPA Grande ring. Very little customization was carried out on the major hardware components of the mission such as the telescope and spacecraft bus. This enabled the mission to minimize non-recurring engineering costs. Credit: Barclay et al.
Pandora’s telescope is a 45-centimeter aluminum Cassegrain instrument with two detector assemblies for the visible and near-infrared channels, the latter of which was originally developed for JWST. Its observations will serve as a valuable resource against which to examine JWST data, making it possible to distinguish a signal that may be from the upper layers of a star from the signature of gases in the planet’s atmosphere. The long stare will make it possible to accumulate over 200 hours of data on each of the mission’s targets. Let me quote a paper on the mission, one written as an overview developed for the 2025 IEEE Aerospace Conference:
Pandora is designed to address stellar contamination by collecting long-duration observations, with simultaneous visible and short-wave infrared wavelengths, of exoplanets and their host stars. These data will help us understand how contaminating stellar spectral signals affect our interpretation of the chemical compositions of planetary atmospheres. Over its one-year prime mission, Pandora will observe more than 200 transits from at least 20 exoplanets that range in size from Earth-size to Jupiter-size, and provide a legacy dataset of the first long-baseline visible photometry and near-infrared (NIR) spectroscopy catalog of exoplanets and their host stars.
A part of NASA’s Astrophysics Pioneers Program, Pandora comes in at under $20 million. It also has taken advantage of the rideshare concept, being launched beside two other spacecraft. The Star-Planet Activity Research CubeSat (SPARCS) is designed to study stellar flares and UV activity that can affect atmospheres and habitable conditions on target worlds. The topic is of high interest given our growing ability to analyze exoplanets around small M-dwarf stars, whose habitable zones expose them to high levels of UV. BlackCAT is an X-ray telescope designed to delve into gamma-ray bursts and other explosions of cosmic proportion from the earliest days of the cosmos.
Pandora will now go through systems checks by its primary builder, Blue Canyon Technologies, before control transitions to the University of Arizona’s Multi-Mission Operation Center in Tucson. The overview paper summarizes its place in the constellation of space observatories:
…a number of JWST observing programs aimed at detecting and characterizing atmospheres on Earthlike worlds are finding that stellar spectral contamination is plaguing their results. Typical transmission spectroscopic observations for exoplanets from large missions like JWST focus on collecting data for one or a small number of transits for a given target, with short observing durations before and after the transit event. In contrast to large flagship missions, SmallSat platform enable long-duration measurements for a given target. Pandora can thus collect an abundance of out-of-transit data that will help characterize the host star and directly address the problem of stellar contamination. The Pandora Science Team will select 20 primary science exoplanet host stars that span a range of stellar spectral types and planet sizes, and will collect a minimum of 10 transits per target, with each observation lasting about 24 hours. This results in 200 days of science observations required to meet mission requirements. With a one-year primary mission lifetime, this leaves a significant fraction of the year of science operations that can be used for spacecraft monitoring and additional science.
The paper is Barclay et al., “The Pandora SmallSat: A Low-Cost, High Impact Mission to Study Exoplanets and Their Host Stars,” prepared for the 2025 IEEE Aerospace Conference (preprint).
Explaining Cloud-9: A Celestial Object Like No Other
Some three years ago, the Five-Hundred Meter Aperture Spherical Telescope (FAST) in Guizhou, China discovered a gas agglomeration that was later dubbed Cloud-9. It’s a cute name, though unintentionally so, as this particular cloud is simply the ninth thus far identified near the spiral galaxy Messier 94 (M94). And while gas clouds don’t particularly call attention to themselves, this one is a bit of a stunner, as later research is now showing. It’s thought to be a gas-rich though starless cloud of dark matter, a holdover from early galaxy formation.
Scientists are referring to Cloud-9 as a new type of astronomical object. FAST’s detection at radio wavelengths has been confirmed by the Green Bank Telescope and the Very Large Array in the United States. The cloud has now been studied by the Hubble telescope’s Advanced Camera for Surveys, which revealed its complete lack of stars. That makes this an unusual object indeed.
Alejandro Benitez-Llambay (Milano-Bicocca University, Milan) is principal investigator of the Hubble work and lead author of the paper just published in The Astrophysical Journal Letters. The results were presented at the ongoing meeting of the American Astronomical Society in Phoenix. Says Benitez-Llambay:
“This is a tale of a failed galaxy. In science, we usually learn more from the failures than from the successes. In this case, seeing no stars is what proves the theory right. It tells us that we have found in the local Universe a primordial building block of a galaxy that hasn’t formed.”
Here there’s a bit of a parallel with our recent discoveries of interstellar objects moving through our Solar System. In both cases, we are discovering a new type of object, and in both cases we are bringing equipment online that will, in relatively short order, almost certainly find more. We get Cloud-9 through the combination of radio detection via FAST and analysis by the Hubble space telescope, which was able to demonstrate that the object does lack stars.
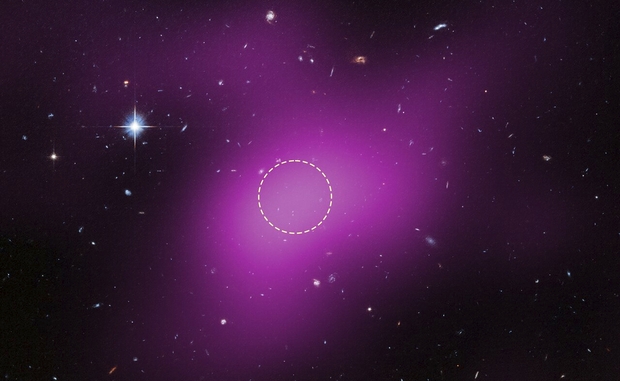
Image: This image shows the location of Cloud-9, which is 14 million light-years from Earth. The diffuse magenta is radio data from the ground-based Very Large Array (VLA) showing the presence of the cloud. The dashed circle marks the peak of radio emission, which is where researchers focused their search for stars. Follow-up observations by the Hubble Space Telescope’s Advanced Camera for Surveys found no stars within the cloud. The few objects that appear within its boundaries are background galaxies. Before the Hubble observations, scientists could argue that Cloud-9 is a faint dwarf galaxy whose stars could not be seen with ground-based telescopes due to the lack of sensitivity. Hubble’s Advanced Camera for Surveys shows that, in reality, the failed galaxy contains no stars. Credit: Science: NASA, ESA, VLA, Gagandeep IAnand (STScI), Alejandro Benitez-Llambay (University of Milano-Bicocca); Image Processing: Joseph DePasquale (STScI).
We can refer to Cloud-9 as a Reionization-Limited H Ι Cloud, or RELHIC (that one ranks rather high on my acronym cleverness scale). H I is neutral atomic hydrogen, the most abundant form of matter in the universe. The paper formally defines RELHIC as “a starless dark matter halo filled with hydrostatic gas in thermal equilibrium with the cosmic ultraviolet background.” This would be primordial hydrogen from the earliest days of the universe, the kind of cloud we would normally expect to have become a ‘conventional’ spiral galaxy.
The lack of stars here leads co-author Rachael Beaton to refer to the object as an ‘abandoned house,” one which likely has others of its kind still awaiting discovery. In comparison with the kind of hydrogen clouds we’ve identified near our own galaxy, Cloud-9 is smaller, certainly more compact, and unusually spherical. Its core of neutral hydrogen is measured at roughly 4900 light years in diameter, with the hydrogen gas itself about one million times the mass of the Sun. The amount of dark matter needed to create the gravity to balance the pressure of the gas is about five billion solar masses. While the researchers do expect to find more such objects, they point out that ram pressure stripping can deplete gas as any cloud moves through the space between galaxies. In other words, the population of objects like RELHIC is likely quite small.
The paper places the finding of Cloud-9 in context within the framework now referred to as Lambda Cold Dark Matter (ACDM), which incorporates dark energy via a cosmological constant into a schemata that includes dark matter and ordinary matter. Quoting the paper’s conclusion:
In the ΛCDM framework, the existence of a critical halo mass scale for galaxy formation naturally predicts galaxies spanning orders of magnitude in stellar mass at roughly fixed halo mass. This threshold marks a sharp transition at which galaxy formation becomes increasingly inefficient (A. Benitez-Llambay & C. Frenk 2020), yielding outcomes that range from halos entirely devoid of stars to those able to form faint dwarfs, depending sensitively on their mass assembly histories. Even if Cloud-9 were to host an undetected, extremely faint stellar component, our HST observations, together with FAST and VLA data, remain fully consistent with these theoretical expectations. Cloud-9 thus appears to be the first known system that clearly signals this predicted transition, likely placing it among the rare RELHICs that inhabit the boundary between failed and successful galaxy formation. Regardless of its ultimate nature, Cloud-9 is unlike any dark, gas-rich source detected to date.
The paper is Gagandeep S. Anand et al., “The First RELHIC? Cloud-9 is a Starless Gas Cloud,” The Astrophysical Journal Letters, Volume 993, Issue 2 (November 2025), id.L55, 7 pp. Full text.
Astrobiology: What Our Planet Can Teach Us
Will 2026 be the year we detect life elsewhere in the universe? The odds seem against it, barring a spectacular find on Mars or an even more spectacular SETI detection that leaves no doubt of its nature. Otherwise, this new year will continue to see us refining large telescopes, working on next generation space observatories, and tuning up our methods for biosignature detection. All necessary work if we are to find life, but no guarantee of future success.
It is, let’s face it, frustrating for those of us with a science fictional bent to consider that all we have to go on is our own planet when it comes to life. We are sometimes reminded that an infinite number of lines can pass through a single point. And yes, it’s true that the raw materials of life seem plentiful in the cosmos, leading to the idea that living planets are everywhere. But we lack evidence. We have exactly that one data point – life as we know it on our own planet – and every theory, every line we run through it is guesswork.
I got interested enough in the line and the data point quote that I dug into its background. As far as I can find, Leonardo da Vinci wrote an early formulation of a mathematical truth that harks back to Euclid. In his notebooks, he says this:
“…the line has in itself neither matter nor substance and may rather be called an imaginary idea than a real object; and this being its nature it occupies no space. Therefore an infinite number of lines may be conceived of as intersecting each other at a point, which has no dimensions…”
It’s not the same argument, but close enough to intrigue me. I’ve just finished Jon Willis’ book The Pale Blue Data Point (University of Chicago Press, 2025), a study addressing precisely this issue. The title, of course, recalls the wonderful ‘pale blue dot’ photo taken from Voyager 1 in 1990. Here Earth itself is indeed a mere point, caught within a line of scattered light that is an artifact of the camera’s optics. How many lines can we draw through this point?
We’ve made interesting use of that data point in a unique flyby mission. In December, 1990 the Galileo spacecraft performed the first of two flybys of Earth as part of its strategy for reaching Jupiter. Carl Sagan and team used the flyby as a test case for detecting life and, indeed, technosignatures. Imaging cameras, a spectrometer and radio receivers examined our planet, recording temperatures and identifying the presence of water. Oxygen and methane turned up, evidence that something was replenishing the balance. The spacecraft’s plasma wave experiment detected narrow band emissions, strong signs of a technological, broadcasting civilization.

Image: The Pale Blue Dot is a photograph of Earth taken Feb. 14, 1990, by NASA’s Voyager 1 at a distance of 3.7 billion miles (6 billion kilometers) from the Sun. The image inspired the title of scientist Carl Sagan’s book, Pale Blue Dot: A Vision of the Human Future in Space, in which he wrote: “Look again at that dot. That’s here. That’s home. That’s us.” NASA/JPL-Caltech.
So that’s a use of Earth that comes from the outside looking in. Philosophically, we might be tempted to throw up our hands when it comes to applying knowledge of life on Earth to our expectations of what we’ll find elsewhere. But we have no other source, so we learn from experiments like this. What Willis wants to do is to look at the ways we can use facilities and discoveries here on Earth to make our suppositions as tenable as possible. To that end, he travels over the globe seeking out environs as diverse as the deep ocean’s black smokers, the meteorite littered sands of Morocco’s Sahara and Chile’s high desert.
It’s a lively read. You may remember Willis as the author of All These Worlds Are Yours: The Scientific Search for Alien Life (Yale University Press, 2016), a precursor volume of sorts that takes a deep look at the Solar System’s planets, speculating on what we may learn around stars other than our own. This volume complements the earlier work nicely, in emphasizing the rigor that is critical in approaching astrobiology with terrestrial analogies. It’s also a heartening work, because in the end the sense of life’s tenacity in all the environments Willis studies cannot help but make the reader optimistic.
Optimistic, that is, if you are a person who finds solace and even joy in the idea that humanity is not alone in the universe. I certainly share that sense, but some day we need to dig into philosophy a bit to talk about why we feel like this.
Willis, though, is not into philosophy, but rather tangible science. The deep ocean pointedly mirrors our thinking about Europa and the now familiar (though surprising in its time) discovery by the Galileo probe that this unusual moon contained an ocean. The environment off northwestern Canada, in a region known as the Juan Fuca Plate, could not appear more unearthly than what we may find at Europa if we ever get a probe somehow underneath the ice.
The Endeavor hydrothermal vent system in this area is one of Earth’s most dramatic, a region of giant tube worms and eyeless shrimp, among other striking adaptations. Vent fluids produce infrared radiation, an outcome that evolution developed to allow these shrimp a primitive form of navigation.
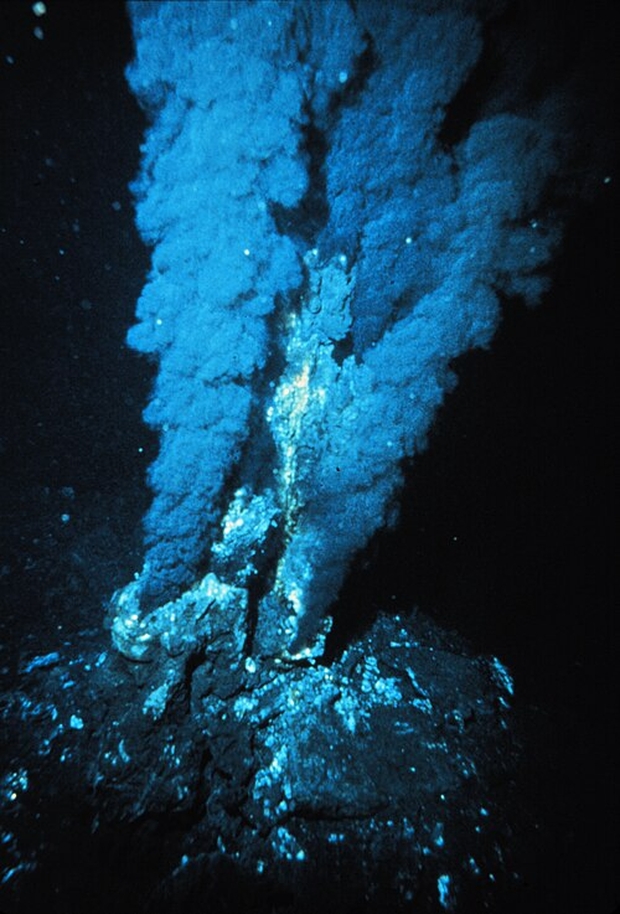
Image: A black smoker at the ocean floor. Will we find anything resembling this on moons like Europa? Credit: NOAA.
Here’s Willis reflecting on what he sees from the surface vessel Nautilus as it manages two remotely operated submersibles deep below. Unfolding on its computer screens is a bizarre vision of smoking ‘chimneys’ in a landscape he can only describe as ‘seemingly industrial.’ These towering structures, one of them 45 feet high, show the visual cues of powering life through geological heat and chemistry. Could a future ROV find something like this inside Europa?
It is interesting to note that the radiation produced by hydrothermal vents occurs at infrared wavelengths similar to those produced by cool, dim red dwarf stars such as Proxima Centauri, the closest star to our Sun and one that hosts its own Earth-sized rocky planet. Are there as yet any undiscovered terrestrial microbes at hydrothermal vents that have adapted the biochemistry of photosynthesis to exploit this abundant supply of infrared photons in the otherwise black abyss? Might such extreme terrestrial microbes offer an unexpected vision of life beyond the solar system?
The questions that vistas like this spawn are endless, but they give us a handle on possibilities we might not otherwise possess. After all, the first black smokers were discovered as recently as 1979. Before that, any hypothesized ocean on an icy Jovian moon would doubtless have been considered sterile. Willis goes on:
It is a far-out idea that remains speculation — the typical photon energy emitted from Proxima Centauri is five times greater than that emerging from a hydrothermal vent. However, the potential it offers us to imagine a truly alien photosynthesis operating under the feeble glow of a dim and distant sun makes me reluctant to dismiss it without further exploration of the wonders exhibited by hydrothermal vents.
We can also attack the issue of astrobiology through evidence that comes to us from space. In Morocco, Willis travels with a party that prospects for meteorites in the desert country that is considered prime hunting ground because meteorites stand out against local rock. He doesn’t find any himself, but his chapter on these ‘fallen stars’ is rich in reconsideration of Earth’s own past. For just as some meteorites help us glimpse ancient material from the formation of the Solar System, other ancient evidence comes from our landings at asteroid Ryugu and Bennu, where we can analyze chemical and mineral patterns that offer clues to the parent object’s origins.
It’s interesting to be reminded that when we find meteorites of Martian origin, we are dealing with a planet whose surface rocks are generally much older than those we find on Earth, most of which are less than 100 million years old. Mars by contrast has a surface half of which is made up of 3 billion year old rocks. Mars is the origin of famous meteorite ALH84001, briefly a news sensation given claims for possible fossils therein. Fortunately our rovers have proven themselves in the Martian environment, with Curiosity still viable after thirteen Earth years, and Perseverance after almost five. Sample return from Mars remains a goal astrobiologists dream about.
Are there connections between the Archean Earth and the Mars of today? Analyzing the stromatolite fossils in rocks of the Pilbara Craton of northwest Australia, the peripatetic Willis tells us they are 3.5 billion years old, yet evidence for what some see as cyanobacteria-like fossils can nonetheless be found here, part of continuing scientific debate. The substance of the debate is itself informative: Do we claim evidence for life only as a last resort, or do we accept a notion of what early life should look like and proceed to identify it? New analytical tools and techniques continue to reshape the argument.
Even older Earth rocks, 4 billion years old, can be found at the Acasta River north of Yellowknife in Canada’s Northwest Territories. Earth itself is now estimated to be 4.54 billion years old (meteorite evidence is useful here), but there are at least some signs that surface water, that indispensable factor in the emergence of life as we know it, may have existed earlier than we thought.
We’re way into the bleeding edge here, but there are some zircon crystals that date back to 4.4 billion years, and in a controversial article in Nature from 2001, oceans and a continental crust are argued to have existed at the 4.4 billion year mark. This is a direct challenge to the widely accepted view that the Hadean Earth was indeed the molten hell we’ve long imagined. This would have been a very early Earth with a now solid crust and significant amounts of water. Here’s Willis speculating on what a confirmation of this view would entail:
Contrary to long-standing thought, the Hadean Earth may have been ‘born wet; and experienced a long history of liquid water on its surface. Using the modern astrobiological definition of the word, Earth was habitable from the earliest of epochs. Perhaps not continuously, though, as the Solar System contained a turbulent and violent environment. Yet fleeting conditions on the early Earth may have allowed the great chemistry experiment that we call life to have got underway much earlier than previously thought.
We can think of life, as Willis notes, in terms of what defines its appearance on Earth. This would be order, metabolism and the capacity for evolving. But because we are dealing with a process and not a quantity, we’re confounded by the fact that there are no standard ‘units’ by which we can measure life. Now consider that we must gather our evidence on other worlds by, at best, samples returned to us by spacecraft as well as the data from spectroscopic analysis of distant atmospheres. We end up with the simplest of questions: What does life do? If order, metabolism and evolution are central, must they appear at the same time, and do we even know if they did this on our own ancient Earth?
Willis is canny enough not to imply that we are close to breakthrough in any area of life detection, even in the chapter on SETI, where he discusses dolphin language and the principles of cross-species communication in the context of searching the skies. I think humility is an essential requirement for a career choice in astrobiology, for we may have decades ahead of us without any confirmation of life elsewhere, Mars being the possible exception. Biosignature results from terrestrial-class exoplanets around M-dwarfs will likely offer suggestive hints, but screening them for abiotic explanations will take time.
So I think this is a cautionary tone in which to end the book, as Willis does:
…being an expert on terrestrial oceans does not necessarily make one an expert on Europan or Enceladan ones, let alone any life they might contain. However…it doesn’t make one a complete newbie either. Perhaps that reticence comes from a form of impostor syndrome, as if discovering alien life is the minimum entry fee to an exclusive club. Yet the secret to being an astrobiologist, as in all other fields of scientific research, is to apply what you do know to answer questions that truly matter – all the while remaining aware that whatever knowledge you do possess is guaranteed to be incomplete, likely misleading, and possibly even wrong. Given that the odds appear to be stacked against us, who might be brave enough to even try?
But of course trying is what astrobiologists do, moving beyond their individual fields into the mysterious realm where disciplines converge, the ground rules are uncertain, and the science of things unseen but hinted at begins to take shape. Cocconi and Morrison famously pointed out in their groundbreaking 1959 article launching the field of SETI that the odds of success were unknown, but not searching at all was the best way to guarantee that the result would be zero.
We’d love to find a signal so obviously technological and definitely interstellar that the case is proven, but as with biosignatures, what we find is at best suggestive. We may be, as some suggest, within a decade or two of some kind of confirmation, but as this new year begins, I think the story of our century in astrobiology is going to be the huge challenge of untangling ambiguous results.
Building a Library of Science Fiction Film Criticism
Back in the days when VCR tapes were how we watched movies at home, I took my youngest son over to the nearby Blockbuster to cruise for videos. He was a science fiction fan and tuned into both the Star Trek and Star Wars franchises, equally available at the store. But as he browsed, I was delighted to find a section of 1950s era SF movies. I hadn’t realized until then how many older films were now making it onto VCR, and here I found more than a few old friends.
Films of the black and white era have always been a passion for me, and not just science fiction movies. While the great dramas of the 1930s and 40s outshone 1950s SF films, the latter brought the elements of awe and wonder to the fore in ways that mysteries and domestic dramas could not. The experience was just of an entirely different order, and the excitement always lingered. Here in the store I was finding This Island Earth, The Conquest of Space, Earth vs. The Flying Saucers, Forbidden Planet, Rocketship X-M and The Day the Earth Stood Still. Not to mention Invasion of the Body Snatchers.
Note that I’ve linked to some of these but not others. Read on.

Image: Dr. Carrington and his fellow scientists of Polar Expedition 6 studying how the Thing reproduces in the greenhouse of an Arctic research station in 1951’s The Thing from Another World.
Naturally, I loaded up on the SF classics even as my son turned his nose up at this ancient material, with its wonky special effects and wooden dialogue. I never did make him a fan of older movies (not even after introducing him to the Quatermass films!), but just after I began publishing Centauri Dreams, I ran into an SF movie fan who far eclipsed my own knowledge of the genre. Larry Klaes was about the first person who started sending me regular comments on the articles here. That was just after I turned the comments section on in 2005. In the years since he has become a friend, an editorial confidant and a regular contributor.
Klaes on Film
Larry has been an author for most of his life, and he has demonstrated that for the past two decades with his extensive work for Centauri Dreams. His essays have ranged through astronomy, space science, and the history of humanity’s exploration of the heavens. Equally to our purposes, Larry has also had a life-long fascination with science fiction, which helped to spur his interest in space and related subjects from an early age.
You’ll notice that a number of the movies I mentioned above are linked to Larry’s articles on them. The ones without links are obvious targets for future essays. A look through the archives will demonstrate that Larry has tackled everything from 1951’s classic The Thing from Another World to Star Trek: The Motion Picture. He’s written in-depth analyses (and I do mean in-depth) on more recent titles like Interstellar and 2010: The Year We Make Contact. I disagreed with him completely on Interstellar, and disagreements are what make film criticism so much fun.
Moreover, Larry is the kind of film enthusiast who isn’t content simply to put forth his opinions. He digs into the research in such a way that he invariably finds things I had never heard of. He finds clips that illustrate his points and original screenplays that clarify directorial intent. He finds connections that most of us miss (see his treatment of 1955’s Conquest of Space in relation to the Swedish film Aniara and the genre he labels ‘Angst SF’). His coverage of Avatar was so comprehensive that I began talking to him about turning his essays into a book, a project that I look forward to participating in.
Larry’s latest is a deep dive into Aniara, little known in the US, with its depiction of off-world migration and a voyage gone terribly wrong. The film possesses a thematic richness that Larry fully explores as the passengers and crew adapt to dire circumstances with the help of immersive virtual reality. When I read this, I decided it was time to give Larry space in a separate section, as the blog format is too constricted for long-form work. Have a look at the top of the home page and you’ll now see the tab Klaes on Film. The Aniara piece is there, inset into a redesigned workspace that offers ready navigation through the text.

Image: I loved the film but Larry’s look at Interstellar makes incsize points about film-making, public perception and the development of the interstellar idea.
All of Larry’s film essays are now available in the new section, but thus far only the current one on Aniara is embedded in the new format. I’ll be seeing to it that all of the essays are reformatted going forward, so that the disadvantages of the blog format for longer writing are eased.
The goal is to create a space for film criticism that acknowledges the hold the SF genre has acquired over the general public, in many cases inspiring career choices and adjusting how the average person views the interstellar challenge. This is a long-term project, but my web developer Ryan Given at StudioRTP is brilliant at customizing the site’s code and he knows where we’re going from here. I couldn’t keep this site going without Ryan’s expert guidance.
As my own passions in film are by today’s standards archaic (I’m still a black and white guy at heart), I’m glad to have someone who can tackle not just the classics of the field but also the latest blockbusters and the quirky outliers. And I wouldn’t mind seeing Larry’s thoughts on the TV version of Asimov’s Foundation either. Let’s keep him busy.