Interesting news about Jupiter this morning even as the Juno spacecraft crosses into the realm of Jupiter’s gravity. It was six days ago that Juno made the transition into Jupiter space, where the gravitational influence of Jupiter now dominates over all other celestial bodies. And it will be on July 4 of this year that Juno performs a 35-minute burn of its main engine, imparting a 542 meters per second mean change in velocity to the spacecraft for orbital insertion.
The spacecraft’s 37 flybys will close to within 5000 kilometers of the cloud tops. I only wish Poul Anderson could be alive to see some of the imagery. I always think of him in relation to Jupiter because of his stunning 1957 story “Call Me Joe,” describing the exploration of the planet by remote-controlled life forms (available in Anderson’s collection The Dark Between the Stars as well as various science fiction anthologies).
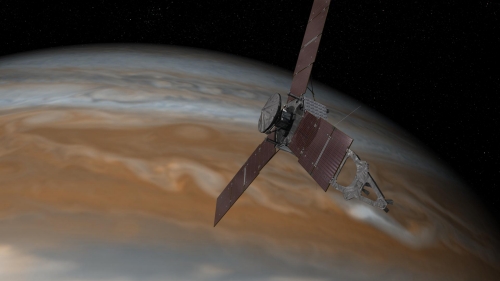
Image: Launched in 2011, the Juno spacecraft will arrive at Jupiter in 2016 to study the giant planet from an elliptical, polar orbit. Juno will repeatedly dive between the planet and its intense belts of charged particle radiation, traveling from pole to pole in about an hour, and coming within 5,000 kilometers of the cloud tops at closest approach. Credit: NASA/JPL-Caltech.
Our view of Jupiter has changed a lot since 1957, and Anderson’s low temperature, high pressure surface conditions have been ruled out, but the tale still carries quite a punch. As to Jupiter itself, today we get news that data from the Very Large Array (New Mexico) have been used to create the most detailed radio map ever made of its atmosphere. The work allows researchers to probe about 100 kilometers below the cloud tops using radio emissions at wavelengths where the clouds themselves are transparent.
Recent upgrades to the VLA have improved the array’s sensitivity by a factor of 10, a fact made apparent by the new Jupiter maps. Working the entire frequency range between 4 and 18 gigahertz, the team from UC-Berkeley supplements the Juno mission, anticipating its arrival to create a map that can put the spacecraft’s findings into context. Because the thermal radio emissions are partially absorbed by ammonia, it’s possible to track flows of the gas that define cloud-top features like bands and spots at various depths within the atmosphere.
We’re learning how the interactions between internal heat sources and the atmosphere produce the global circulation and cloud formation we see in Jupiter and other gas giant planets. The three-dimensional view shows ammonium hydrosulfide clouds rising into the upper cloud layers along with ammonia ice clouds in colder regions, while ammonia-poor air sinks into the planet amidst ‘hotspots’ (bright in radio and thermal infrared) that are low in ammonia and circle the planet just north of its equator.
“With radio, we can peer through the clouds and see that those hotspots are interleaved with plumes of ammonia rising from deep in the planet, tracing the vertical undulations of an equatorial wave system,” said UC Berkeley research astronomer Michael Wong.
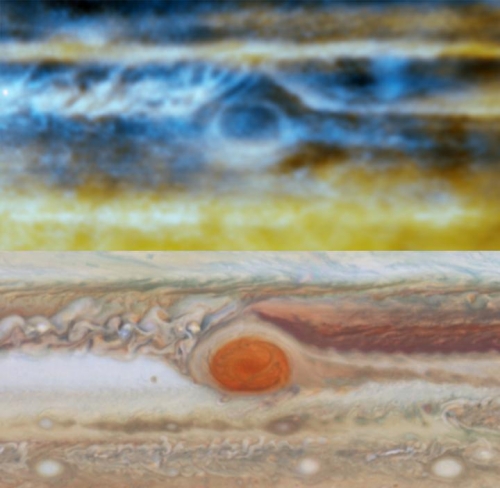
Image: The VLA radio map of the region around the Great Red Spot in Jupiter’s atmosphere shows complex upwellings and downwellings of ammonia gas (upper map), that shape the colorful cloud layers seen in the approximately true-color Hubble map (lower map). Two radio wavelengths are shown in blue (2 cm) and gold (3 cm), probing depths of 30-90 kilometers below the clouds. Credit: Radio: Michael H. Wong, Imke de Pater (UC Berkeley), Robert J. Sault (Univ. Melbourne). Optical: NASA, ESA, A.A. Simon (GSFC), M.H. Wong (UC Berkeley), and G.S. Orton (JPL-Caltech).
Fine structure becomes visible in this work, especially in the areas near the Great Red Spot. The resolution is about 1300 kilometers, considered to be the best spatial resolution ever achieved in a radio map. “We now see high ammonia levels like those detected by Galileo from over 100 kilometers deep, where the pressure is about eight times Earth’s atmospheric pressure, all the way up to the cloud condensation levels,” says principal author Imke de Pater (UC-Berkeley). The work is reported in the June 3 issue of Science.
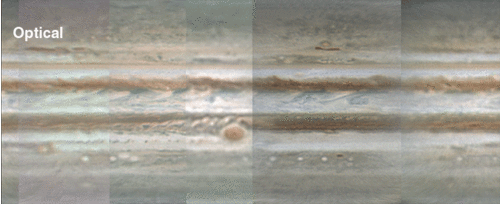
Image: In this animated gif, optical images of the surface clouds encircling Jupiter’s equator –including the famous Great Red Spot — alternate with new detailed radio images of the deep atmosphere (up to 30 kilometers below the clouds). The radio map shows ammonia-rich gases rising to the surface (dark) intermixed with descending, ammonia-poor gases (bright). In the cold temperatures of the upper atmosphere (160 to 200 Kelvin, or -170 to -100 degrees Fahrenheit), the rising ammonia condenses into clouds, which are invisible in the radio region. Credit: Radio: Robert J. Sault (Univ. Melbourne), Imke de Pater and Michael H. Wong (UC Berkeley). Optical: Marco Vedovato, Christopher Go, Manos Kardasis, Ian Sharp, Imke de Pater.
Earlier VLA measurements of ammonia levels in Jupiter’s atmosphere had shown much less ammonia than what the Galileo probe found when it plunged into the atmosphere in 1995. The new work resolves the issue by applying a technique to remove the blurring in radio maps that occurs because of Jupiter’s fast rotation. The UC-Berkeley team reports that it can clearly distinguish upwelling and downwelling ammonia flows using the new methods, preventing the confusion between the two that had led to the earlier mis-estimates of ammonia levels.
The paper is de Pater et al., “Peering through Jupiter’s Clouds with Radio Spectral Imaging,” Science 3 June 2016 (abstract).


I would love to see a nuclear ram jet probe in the atmosphere of jupiter, it could roam at will and take a lot of readings.
That’s on the dream list.
How about a balloon or dirigible instead? The technology already exists, albeit it will need updating to handle cold and different atmospheric gases..
Yes, but it would need heating by a nuclear source which would be fairly easy. Perhaps a hybrid glider, to ride thermals, and a heated balloon/dirigable. The gases should be no problem to PTFE, not to sure about a lighning strike though.
Venus would be a good target as well for a modern space blimp. IIRC the later Russian probes had a go at this, but proper modern image feeds would be a treat. Pathfinder to futuristic floaty space cities, pethaps?
You mean like a ‘cloud city’? Thirty two billion cubic feet of hydrogen will lift a billion tons to the edge of space so we might find that gas mining thingy viable if we can reduce the vessel mass without volume loss. Trillion dollar kickstarter and launch from earth to jupiter.
A cloud city on Venus is quite possible, this is a good site by Robert Walker which discusses the concept.
http://www.science20.com/robert_inventor/will_we_build_colonies_that_float_over_venus_like_buckminster_fullers_cloud_nine-127573
I would love to see gliders and balloons in the atmosphere of all the major planets.
The nuclear ramjet technology exists, as well, sort of. They successfully tested one, running it for 5 minutes, apparently (https://en.wikipedia.org/wiki/Project_Pluto). It could be simpler* hardware than a balloon or dirigible, orders of magnitude faster and easier to deploy from orbit.
I also would also like to see a submersible probe, i.e. one that enters the atmosphere slowly enough that it keeps sinking at terminal velocity (quite slow, I think, once the pressure is up to many atmospheres) until it finally collapses. Much like the Venera Venus probes, which took advantage of the high pressure to soft land without parachute, if I remember correctly. Perhaps it could be built without cavities of any sort so it could stand up to immense pressure before failing. Perhaps you could use a simple propeller (like on a boat) to keep afloat and move around a little.
*A reactor would be needed for both, I think, and the actual ramjet is a very simple, near solid state configuration, as I understand.
Ah, It seems like the Galileo probe was close to such a submersible, although it failed much earlier than the Veneras did. Some of the latter reached the surface of Venus at 100 atmospheres and 450 degrees C. Galileo failed at 23 atmospheres and 153 degrees C.
So, it does not seem out of line that a sturdier submersible could go deeper, where increased viscosity would make the atmosphere more like water than air. The probe could use wings/fins to glide and maneuver, easily. There should be plenty of thermal winds/currents to exploit for staying aloft indefinitely without propulsion, and energy for the avionics could be generated by exploiting pressure and/or temperature gradients, like here: http://www.livescience.com/2277-submersible-robot-runs-sea-heat.html.
Maybe these radio waves will show us where the thermal updrafts are so when we do deploy a glider/balloon it can navigate them and stay aloft for years.
If Venus’ surface happened to not ‘get in the way’, I wonder how much more the Veneras could’ve taken… (they lasted at least 20mins, if not a couple of hours, iirc, beokre the heat got to them). It’s the theoretical pressure limits I’d be interested in.
Great pressures can be handled, diamond at around 50 or more GPa, that is around 500 000 atmospheres but it is the temperature that kills the electronic.
One way to withstand great pressures is to avoid cavities of any sort in the design. All parts would need to stand up to potentially corrosive atmospheric conditions, and moving parts would have to be designed with higher “air” viscosity in mind.
I think a probe could be designed to withstand great temperatures, too, using ceramics and tungsten instead of plastic and aluminum. Computer chips could centralized and actively cooled.
Very interesting data… Is this information creating any new theories about what is causing the red spot?
I always thought a dwarf star encased in a proton dyson sphere and the red storm is over the opening (breach) where red wavelength light emerges through hole.
Explains the high diameter vs mass (compared to earth), red eye, and lack of second star in the system.
I’m particular to the Redspot being the terminal to a large birkland current pierced through the magnetic field of Jupitor carrying the positive electrical current from the Sun.
Id love to see even a balloon or blimp gather data over a period of time… Maybe a blimp that could launch small reusable
aircraft or periodically drop small instrument packages on parachutes.
As someone who was around when the first Pioneer probe flew by Jupiter in. I think 1972, the fact that they now can place the probe in a polar orbit about the planet is nothing short of amazing, while they move through the clouds of that planet.
The first Pioneer probe was a flyby and it became almost overwhelmed by the intense radiation surrounding the planet. It became almost the end of the spacecraft, but it survived. Now they can routinely deal with that intense radiation and do scientific studies. Absolutely amazing!
No feasability in igniting Jupiter as a secondary star though.
To “ignite” Jupiter, we’d have to increase the electrical current density as it’s surface. Perhaps a massive conductive hoop with a center at L1, carrying a DC current, could focus a wider area of solar wind towards Jupiter.
A giant superconducting ring with josephson junctions?
How many ‘Monoliths’ do you have handy…?
here is the link to the paper:
http://science.sciencemag.org/content/352/6290/1198
Thanks! That reminded me to insert the link — had gotten behind in the schedule and almost forgot.
Maybe that can be part of how one creates a self powering system, where one superconductor is positioned to take power from the solar wind and transfer it into the second superconductor that creates the magnetic field/lens that directs/focuses that energy onto Jupiter.