Given their distance from the Sun, the gas and ice giants of our Solar System should not have upper atmospheres as hot as they are. Clearly, something is happening at the planets themselves to account for the warmth, and new analysis of Cassini data, just published in Nature Astronomy, lays out the case for auroral activity at the north and south poles of Saturn as the explanation there. The paper offers the results of the most complete mapping yet made of the temperature and density of a gas giant planet’s upper atmosphere.
Tommi Koskinen, a co-author on the paper describing these findings is a member of Cassini’s Ultraviolet Imaging Spectrograph (UVIS) team:
“The results are vital to our general understanding of planetary upper atmospheres and are an important part of Cassini’s legacy. They help address the question of why the uppermost part of the atmosphere is so hot while the rest of the atmosphere – due to the large distance from the Sun – is cold.”
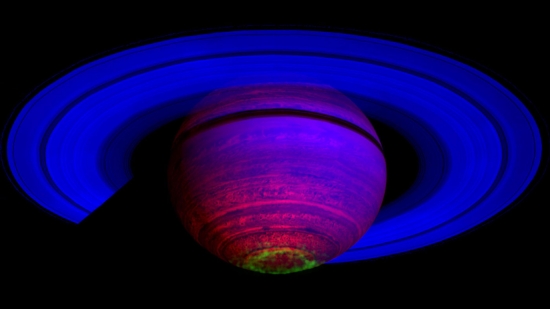
Image: This false-color composite image, constructed from data obtained by NASA’s Cassini spacecraft, shows the glow of auroras streaking out about 1,000 kilometers (600 miles) from the cloud tops of Saturn’s south polar region. It is among the first images released from a study that identifies images showing auroral emissions out of the entire catalogue of images taken by Cassini’s visual and infrared mapping spectrometer. Credit: NASA/JPL/ASI/University of Arizona/University of Leicester.
The process at Saturn is much the same as what drives Earth’s auroral activity. Plasma from the solar wind moves along magnetic field lines in the upper atmosphere, where electrons collide with atmospheric atoms and molecules, exciting them to higher energy levels that radiate light at various colors and wavelengths. The differences in atmospheric composition mean that at Saturn, the light we see comes from emissions of molecular and atomic hydrogen.
Like Voyager, the trove of Cassini data keeps churning up new insights. In this case, we’re dealing with data collected during the spacecraft’s Grand Finale, the 22 breathtakingly tight orbits made before the craft was flown into Saturn’s atmosphere to protect potentially life-bearing moons like Enceladus. Cassini had already orbited Saturn for more than 13 years and was at the end of its fuel supply, but those final orbits were exceedingly productive.
Targeting bright stars in the constellations of Orion and Canis Major, Cassini spent six weeks observing the stars rising and setting behind the planet, allowing scientists to measure the changes in starlight passing through the atmosphere. The temperature map used in the new paper relies on density measurements that provided the information needed to calculate atmospheric temperatures. Temperatures were found to peak near the auroras, giving credence to the idea that auroral electric currents are the heat source for the upper atmosphere.
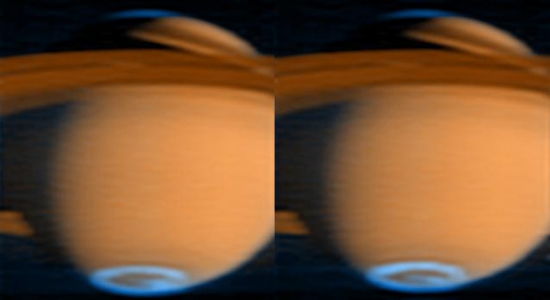
Image; The aurora at Saturn’s southern pole is visible in these false-color images, gathered by Cassini’s ultraviolet imaging spectrograph (UVIS) on June 21, 2005. Blue represents aurora emissions from hydrogen gas excited by electron bombardment, while red-orange represents reflected sunlight. The images show that the aurora lights at the polar regions respond rapidly to changes in the solar wind. Previous images have been taken closer to the equator, making it difficult to see the polar regions. Changes in the emissions inside the Saturn south-pole aurora are visible by comparing the two images, taken about one hour apart. The brightest spot in the left aurora fades, and a bright spot appears in the middle of the aurora in the second image. Credit: NASA/JPL/University of Colorado.
The rate of density decrease in the atmosphere depends on temperature, and the combination of temperature and density measurements helped the researchers determine the speed of the winds at altitude. Thus we get a glimpse of the zone where space weather interacts directly with a planet, showing how a global wind system distributes energy that is initially accumulated near the poles and then flows on into the equatorial regions. We wind up with the observed temperatures at altitude that are twice what we would expect from solar heating alone.
The paper is Brown et al., “A pole-to-pole pressure-temperature map of Saturn’s thermosphere from Cassini Grand Finale data,” Nature Astronomy 6 April 2020 (abstract).


I don’t know the absolute brightness of the aurora in those images but I wondered how bright it could possibly be. After all, at 10 AU the density of the solar wind would be roughly 0.01 that of Earth. Next is the planetary diameter, which is not quite 10x that of Earth so the projected area is roughly 100x that of Earth. So, 0.01 x 100 = 1.
As a first order approximation this is interesting. Of course there’s a lot more to it than this, in particular the dynamics of Saturn’s magnetic field.
It’s more than just the solar wind speed. The charged particles protons and electrons from the solar wind get trapped in Saturn’s magnetic field where they become accelerated in Saturn’s magnetic field which is much larger than Earths. The charged solar wind particles follow the magnetic field lines of Saturn down towards the poles where they collide with the upper atmosphere where the air particles are excited and re emit like light like the northern lights or Aurora Borealis in Earth’s atmosphere. These excited atmospheric particles represents a high temperature, but only in a rarefied ionosphere where the molecules are widely separated, so it is dubious that the aurora of Saturn are heating it’s upper atmosphere and making it hotter than expected from solar radiation. Most likely the heating is due to a radiation and convection of the heat from the gravitational compression of the core of Saturn which is 21,000 F. The same thing happens with Jupiter’s atmosphere which emits more heat that it receives from solar radiation.
Planets around M dwarfs would have their atmosphere heated to a very large degree, possibly heating the lower atmosphere in the process. Their magnetic field would be impacted by the large close flares and and may cause an atmosphere that is alien to any known.