Centauri Dreams
Imagining and Planning Interstellar Exploration
Jupiter’s Great Red Spot as Heat Source
Speculating about what an advanced extraterrestrial civilization might do has kept us occupied for the last two days, with gas giants like Jupiter the primary topic of conversation. We don’t know if it’s possible to ignite a gas giant to provide new sources of energy. But with Juno getting ready to measure Jupiter’s aurorae, we’re looking at naturally produced energy today, and now we have interesting work on the planet’s Great Red Spot that comes out of Earth-based observations. The enormous storm turns out to be a key factor in heating Jupiter’s atmosphere.
And what a storm it is. We knew about the Great Red Spot as early as the 17th Century because its span — three Earth diameters — qualifies this highly visible maelstrom as the largest hurricane we know of. Winds can take six days to complete one circuit of the Great Red Spot, which has varied in size and color ever since it was discovered. It is now observed to span 22,000 km by 12,000 km in longitude and latitude, respectively.
The Great Red Spot gives us a source of energy to heat Jupiter’s upper atmosphere but thus far we have lacked evidence of its effect upon temperatures. Now an analysis based upon new infrared data is changing our view of temperatures high above Jupiter’s visible disk.
Image: Acquiring Jovian spectra. Bright regions at the poles result from auroral emissions; the contrast at low- and midlatitudes has been enhanced for visibility. Great Red Spot (GRS) emissions at mid latitudes are indicated by the red arrow. Additional info: The vertical dark line in the middle of the image indicates the position of the spectrometer slit, which was aligned along the rotational axis of Jupiter. Image shown is taken from the slit (slit-jaw imaging) using the “L-filter” (3.13 – 3.53 μm). Credit: J. O’Donoghue, NASA Infrared Telescope Facility (IRTF).
The results come from James O’Donoghue (Boston University) and colleagues, who report their findings on the matter today in Nature, using 2012 data from the SpeX spectrometer on NASA’s Infrared Telescope Facility in Hawaii. The issue caught the astronomers’ attention because at mid- to low latitudes, temperatures in Jupiter’s upper atmosphere are hundreds of degrees warmer than heating from the Sun can explain. We’re looking at non-Solar energy whose sources could be studied by creating heat maps of the entire planet.
This is what the O’Donoghue set out to do, realizing that what his team refers to as an ‘energy crisis’ occurs not just on Jupiter but on other giant planets as well. One explanation for Jupiter has been auroral heating mechanisms that pump energy into the upper atmosphere. But the low to mid-latitudes lack this kind of heat source and yet remain 600 K warmer than can be explained by solar heating. The paper makes the case for a different kind of source:
A more likely energy source is acoustic waves that heat from below (also via viscous dissipation); this form of heating requires vertical propagation of disturbances in the low-altitude atmosphere. Acoustic waves are produced above thunderstorms, and the subsequent waves have been modelled to heat the Jovian upper atmosphere by 10K per day and on Earth have been observed to heat the thermosphere over the Andes mountains. On Jupiter, acoustic-wave heating has been modelled to potentially impart hundreds of degrees of heating to the upper atmosphere. However, to the best of our knowledge, no such coupling between the lower and upper atmosphere has been directly observed for the outer planets, so vertical coupling has not been seriously considered as a solution to the giant-planet energy crisis.
The team found that high altitude temperatures on Jupiter are greater than expected when the Great Red Spot is directly below. In fact, the atmosphere above this region is hundreds of degrees hotter than anywhere else on the planet. The temperature spike above the Great Red Spot points to coupling between lower and upper atmosphere. The authors believe the heating is caused by atmospheric turbulence that rises because of the shear between the storm and surrounding atmosphere, with propagating waves depositing their energies high above.
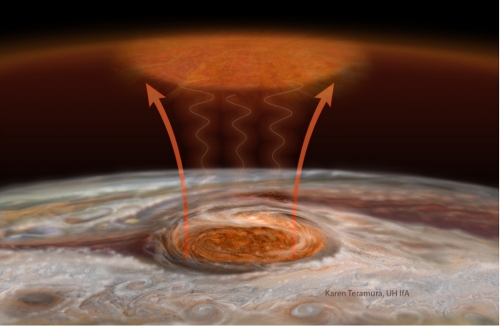
Image: Turbulent atmospheric flows above the storm produce both gravity waves and acoustic waves. Gravity waves are much like how a guitar string moves when plucked, while acoustic waves are compressions of the air (sound waves). Heating in the upper atmosphere 800 kilometers above the storm is thought to be caused by a combination of these two wave types ‘crashing’ like ocean waves on a beach. Credit: Art by Karen Teramura, UH IfA, James O’Donoghue
Co-author Tom Stallard (University of Leicester) puts the work into the context of ongoing missions like Juno:
“This fantastic result, showing how the upper atmosphere is heated from below, was produced directly from Leicester’s 2012 observing campaign, which was designed to try and answer why Jupiter’s upper atmosphere is so hot. Juno will be measuring the aurora and its sources, and we expected the auroral energy to flow from the pole to the equator. Instead, we find the equator appears to be heated from plumes of energy coming from Jupiter’s vast equatorial storms.”
The paper is O’Donoghue et al., “Heating of Jupiter’s upper atmosphere above the Great Red Spot,” Nature, published online 27 July 2016 (abstract).

SETI: Detecting ‘Stellified’ Objects
When Nikolai Kardashev looked into the question of where to find advanced extraterrestrial civilizations, he argued that the obvious starting point would be in the vicinity of extreme astrophysics. Active galactic nuclei (AGN) come to mind, or even the centers of comparatively quiet galaxies like our own. Clément Vidal picked up the same point in his The Beginning and the End (Springer, 2014), arguing persuasively that we should consider how black holes could be used, perhaps by manipulating the merger of such objects. And yes, this is astroengineering utterly beyond our skills, but possibly not those of an advanced ETI.
Using black holes for energy is extreme, but Roger Penrose has imagined a super-civilization extracting black hole rotational energy by the injection of matter, and there are a number of other propositions on how such advanced engineering might work. Extracting energy from a black hole’s accretion disk might be the most efficient method, but lower-grade operations could exist around neutron stars. To that idea we might add, as Milan ?irkovi? does in the paper we looked at yesterday, the exploitation of X-ray binaries or quasars like SS433.
The new ?irkovi? paper homes in on gas giants and brown dwarfs, with the possibility of making either into a star. It’s an idea with a popular pedigree, the ignition of Jupiter having gone viral with the film 2010, but the real action is beyond the Solar System entirely. Consider that the number of substellar objects in interstellar space has been estimated to be as high as 105 times greater than the number of main sequence stars (see Island-Hopping to the Stars for more on this estimate and the kind of substellar objects it references).
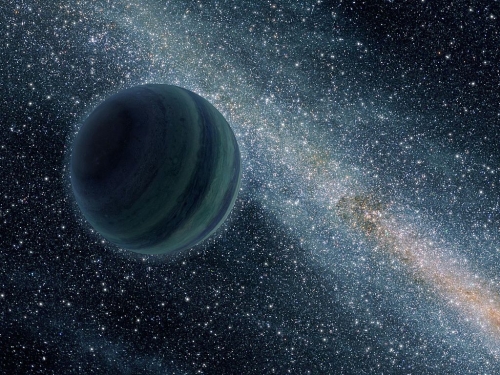
Image: Artist’s impression of a free-floating gas giant. Credit: NASA/JPL-Caltech.
Could a technologically manipulated gas giant or brown dwarf be a SETI observable? Here we can look at several possibilities. The luminosity of a ‘stellified’ object should be greater than its mass would lead us to expect for natural objects. And, taking the long view, its luminosity should evolve differently from natural stars. Moreover, we might find anomalies in the spectra of such objects, especially early and late in their astronomically-brief lifetimes. And bear in mind that stellified objects would be bright power sources, unlike artificial orbital habitats or other large structures which would only reflect light or become apparent through their thermal emissions.
In other words, if such objects exist, they would be useful targets for Dysonian SETI investigation. ?irkovi? notes that determining the mass of a field star is a tricky proposition, and if we’re considering possible artifacts, we can’t just try to position the object on the Hertzsprung-Russell diagram as if it were a normal main sequence star. An accurate mass determination would require a multiple star system, and even here the measurement is fraught with uncertainties. But where we can determine it, mass is worth pursuing.
From the ?irkovi? paper, referring to Martyn Fogg’s 1989 paper on stellified gas giants:
The outliers from the low-mass stellar luminosity-mass relation deserve our best observational scrutiny, especially if the anomaly is extreme. In Fogg’s model, for instance, luminosity of [a] stellified Jupiter will fairly soon after the beginning of the process be ten orders of magnitude or so above the expected luminosity of such a low-mass free-floating object. If such artefacts are numerous in the Galaxy, their considerably easier detectability could deform and leave an imprint on the substellar mass function.
The evolution of luminosity in such objects would be challenging to gauge because of the timeframes involved — Fogg estimated a 50 million year span of exponentially increasing luminosity in the case of a stellified gas giant like Jupiter. As ?irkovi? notes, we could easily have such artifacts in our stellar catalogs now, for depending on their stage of stellification, they would simply mimic a particular type of star. We seem to be best off in hunting for stellified objects at the beginning and end of their lifetimes, looking for gamma and X-ray flares, for example, during the early stages of a planet’s transformation into a star.
Even so, we still are dealing with relatively transient phenomena compared to main sequence star lifetimes, and advanced technologies about which we can only speculate. Remember that the scenario Martyn Fogg originally came up with assumes using a small black hole, merging it with Jupiter in a carefully controlled orbit that eventually brings it toward the planet’s center. 100 million years of habitability are provided to the Jovian satellite system, but several hundred million years later, runaway accretion would have to be prevented. ?irkovi? comments:
For the initial phase, the period of unstable bursting and flaring can be shortened by sufficiently gently placing the mini-black hole into the substellar objects; for the final phase, duration and properties of instabilities depend on the manner of removing the excess mass from the black hole, as well as on the existing installation/swarm surrounding it. If such anomalies are observed in a planetary system containing at least one planet in the circumstellar habitable zone, this could be further incentive to give it high priority as a SETI target.
My take on all this is that as we are at the beginning of Dysonian SETI, we’re early in the process of developing the necessary parameters. ?irkovi? speaks to this point near the end of this paper, calling for improved quantitative models for the kind of astroengineering projects we can imagine and their possible SETI signatures. The advantage of stellified gas giants is that they are larger and simpler than many of the conjectured astroengineering projects that have been proposed, but we would want to have sound models for a wide range of possibilities.
And there’s the nub of the problem: We’d like to be able to observe an anomaly in our astronomical data and relate it swiftly to a potential technology, using what we believe to be its observables. But Dysonian SETI is built around the concept of abandoning anthropocentrism and simply observing. How does a Kardashev sub-Type I culture like ours envision what a Type II might do? Our conjectures invariably grow out of our preconceptions, and the models we build can only be crude templates. Rather than abandoning the process, we have to keep all this in mind, continually adjusting our assumptions while being alert for data that fit no previous niche.
The ?irkovi? paper is “Stellified Planets and Brown Dwarfs as Novel Dysonian SETI Signals,” in press at JBIS. I also referenced a Nikolai Kardashev paper above; it’s “On the inevitability and possible forms of supercivilizations”, in The Search for Extraterrestrial Life: Recent Developments, ed. M.D. Papagiannis, IAU, Dordrecht, pp.497-504, 1985.
Making Jupiter into a Star
The SETI concepts now called ‘Dysonian’ are to my mind some of the most exhilarating ideas in the field. Dysonian SETI gets its name from the ‘Dyson spheres’ and ‘Dyson swarms’ analyzed by Freeman Dyson in a 1960 paper. This is a technology that an advanced civilization might use to harvest the energy of its star. You can see how this plays off Nikolai Kardashev’s classification of civilizations; Kardashev suggested that energy use is a way to describe civilizations at the broadest level. A Type II society is one that can use all the energy of its star.
In the film 2010, director Peter Hyams’ 1984 adaptation of Arthur C. Clarke’s novel 2010: Odyssey Two (Del Rey, 1982), we see an instance of this kind of technology at work, though it has nothing to do with a Dyson sphere. In the film, a dark patch appearing on Jupiter signals the onset of what Martyn Fogg has called ‘stellification,’ the conversion of a gas giant into a small star. Rapidly replicating von Neumann machines — the famous monoliths — increase Jupiter’s density enroute to triggering nuclear fusion.
A new star is born, with consequences entertainingly explored in the novel’s epilogue. Without monoliths to work with, Fogg described another way of triggering a gas giant’s fusion reaction in a 1989 paper. A small black hole could be put into orbit around the planet, its orbit gradually sinking toward the planetary center. Accretion will eventually cause the new star to shine like a red dwarf, its brightness steadily increasing over a 50 million year period. Parts of the Jovian satellite system could be rendered continuously habitable over a period of about 100 million years, even as the star-builders exploit its energies via orbiting power stations.

Image: 2010’s cinematic depiction of runaway replication in progress on Jupiter. Credit: Peter Hyams/Metro-Goldwyn-Mayer.
True, the process would one day have to be arrested, for runaway accretion will eventually, according to Fogg’s calculations, present a danger to these worlds, though presumably the civilization that can create the new star in the first place can also figure out how to tame it. These timeframes are extravagant, of course, and the engineering is far beyond our own, but as Milan ?irkovi? points out in a new paper, we should consider such stellified objects as potential SETI signatures. Dysonian SETI thus expands to a broad search for anomalous uses of energy.
Having never observed an extraterrestrial civilization, can we plausibly look for one? Here’s how ?irkovi?, the author of The Astrobiological Landscape (Cambridge University Press, 2012) and numerous papers, frames the question:
Copernicanism implies that we should reason as if humanity is a typical member of the set of all intelligent species evolved in naturalistic manner in all epochs. Therefore, what we expect in humanity’s future is also likely to occur at some point in the evolutionary trajectory of at least a significant subset of other intelligent species, both those present in the Galaxy nowadays, and those from past or future. If humans could perform an engineering feat X at some point in our future for clearly utilitarian reasons, we should expect at least some other intelligent species in the Galaxy to have already performed the same (or similar enough) X, provided they are sufficiently older from us. In accordance with such “mirroring” of human future and possible evolutionary trajectories of advanced extraterrestrial civilizations in the Galaxy, we may wish to investigate how the procedure of stellification might look from afar and consider it a new form of detection signature in the sense of SETI studies.
Notice that whatever the target, Dysonian SETI makes no assumptions about communications or contact with other civilizations. When we work at radio or optical wavelengths, we are looking for ephemeral signals, most likely some kind of a beacon that announces the existence of the culture that built it. The new Dysonian strategy puts detection times into a much deeper timeframe. We make no social or cultural assumptions and, in fact, can make no conjectures about the beings behind any artifact we find in our searches. One exciting consequence is that a SETI detection may already be present in our abundant stores of astronomical data.
The study of the anomalous star KIC 8462852 likewise touches on Dysonian SETI. While there have been brief attempts to study this object for evidence of power beaming (see SETI: No Signal Detected from KIC 8462852), the star has also been the subject of intense investigation historically, with researchers like Bradley Schaeffer and Michael Hippke reaching different conclusions about whether or not old photographic plates show a steady dimming. Here we’re using astrophysics with no cultural assumptions to delve into a phenomenon that is probably natural, but one so mysterious that we still can’t rule out advanced engineering.
But back to stellification and the question of energy. Let’s ask this: If there were a civilization capable of engineering at a solar system-wide scale, what would it do? The creation of a small star within a solar system is one way to proceed, and in Clarke’s novel it paves the way for the creation of new life on Europa. But the material for stellification is hardly confined to a single system. Usefully, we have large numbers of brown dwarfs and unbound, ‘rogue’ planets between the stars. As ?irkovi? notes, we have resources here not just for fuel but for habitation and industry with significant amounts of metals in relatively shallow gravitational wells.
The key question is, what sort of signature would this kind of stellification produce? More on this tomorrow, as we look a little deeper into Dysonian methods and speculate not only on the uses of thermonuclear fusion but the utilization of other kinds of energy. For if we’re trying to find evidence of astroengineering, extreme astrophysical sources may be the places to look.
The paper is ?irkovi?, “Stellified Planets and Brown Dwarfs as Novel Dysonian SETI Signals,” in press at JBIS. Martyn Fogg’s paper is “Stellifying Jupiter: A first step to terraforming the Galilean satellites,” JBIS 42 (1989), 587-592..
Kepler-80: Analysis of a Compact System
It’s been a week for unusual planetary systems, and I’ll cap it off with Kepler-80, a star about 1100 light years away that features five planets in extraordinarily tight orbits. Such systems are now being referred to as STIPs (Systems with Tightly-spaced Planets), a nod to our apparently imperishable drive to create acronyms. Whatever we call them, though, systems like these make us realize that our own Solar System’s configuration is but one possibility in a sea of other outcomes. Yesterday’s post on ‘warm Jupiters’ is yet another confirmation of the thought.
What we have in new work from Mariah MacDonald, Darin Ragozzine (Florida Institute of Technology) and colleagues is an analysis of transit timing variations (TTVs) of the planets around this star, all of which orbit inside 1/10 AU. Here the planets’ years are 1.0, 3.1, 4.6, 7.1 and 9.5 days, respectively, close enough that gravitational perturbations can create slight changes in transit times. Although the innermost planet has a very weak TTV signal, the other four show signals strong enough for the researchers to work out the masses of each.
Gravitational interactions that disturb a perfectly periodic sequence of transits are a valuable way of making mass estimates for planets small enough that radial velocity detections are difficult. Usefully, Kepler has measured hundreds of TTV signals allowing for such estimates. They’re particularly helpful in multiple-planet transiting systems because now we can use the combination of mass and planetary radius to produce density measurements.
The Kepler-80 planets are f, d, e, b, and c in order of period. The inferred masses for the four outer planets are roughly 6.75, 4.13, 6.93 and 6.74 Earth masses, but we learn that the two outermost planets are almost twice as large as the inner two. The researchers believe this is consistent with terrestrial compositions for d and e and extended, puffy atmospheres of hydrogen and helium for b and c. Here’s how the paper describes these worlds:
Although all four planets have very similar masses, planets d and e are terrestrial and planets b and c have ?2% (by mass) H/He envelopes assuming Earth-like cores. Their orbits are similar and models suggest that photo-evaporation would have removed ?1% H/He from all four planets. Though simulations suggest the system has been affected by planetary tides, we did not consider the effect of dissipation on the atmospheric history of the planets. It is unusual to have four well-measured densities in the same system and future comparative planetology may constrain the formation and evolution of their atmospheres.
Due to orbital resonances, the four outer planets are synchronized, returning to the same configuration every 27 days. The paper notes that Kepler-80’s planetary orbits are stable in the long-term as long as we assume orbital eccentricities below about 0.2 (the researchers point out that TTVs cannot reliably detect eccentricities for this system). Although the available Kepler data are not enough to reveal the evolution of the atmospheres on these planets, the researchers’ simulations show that the outer two planets could have migrated inward from original positions in the disk where accretion of hydrogen and helium would be more likely to occur.
Image: This animation shows the position of the five planets of Kepler-80 whenever the outer two planets (green and red) pass by one another, about every 27 days over the course of four years of observations by NASA’s Kepler Space Telescope. Due to the rare synchronized nature of the system, the middle two planets (blue and purple) also return to almost exactly the same location. The innermost planet (yellow) is not synchronized and hence is found at a random location every 27 days. MacDonald et al. 2016 were able to show that this pattern indicates formation by “migration,” where the orbits shrink very slightly over time. The orbits are to scale with each other, but the planets are shown 50 times larger. The outer four planets are all about 4-6 times the mass of the Earth. The inner three planets (blue, purple, and yellow) appear rocky and the outer two planets (green and red) are likely rocky with a very puffy Hydrogen/Helium atmosphere. Credit: MacDonald/Ragozzine/FIT.
Improved mass and eccentricity estimates will fall to future space-based observatories. With its complex resonances and intriguing dynamical history, Kepler-80 should be a useful laboratory for studying planet formation. The Kepler mission has given us a wealth of information about how planetary systems can be built, and it’s clear that their formation and evolution will be the subject of study for decades. The systems we’ve looked at this week hint at what is possible as exoplanetary architectures continue to surprise us.
The paper is MacDonald et al., “A Dynamical Analysis of the Kepler-80 System of Five Transiting Planets,” accepted at The Astronomical Journal. A Florida Institute of Technology news release is available.
‘Warm Jupiters’ and Nearby Worlds
Where exactly do ‘hot Jupiters’ come from? I usually see explanations involving planetary migration for Jupiter-class objects with tight orbital periods of 10 days or less, the thinking being that such planets are too close to their host stars to have accumulated a Jovian-style gaseous envelope there. Migration explains their placement, with gas giants forming much further out in their planetary systems and then migrating disruptively inward to become hot Jupiters.
Does the scenario work? Consider the hot Jupiter WASP-47b, which has two low-mass planets nearby in its system. WASP-47b is a problem because a migrating gas giant should have produced profound gravitational issues for small worlds in the inner system, likely ejecting them entirely. A new paper from Chelsea Huang and Yanqin Wu (University of Toronto), working with Amaury Triaud (University of Cambridge), tries to explain the dilemma posed by WASP-47b.
The answer turns out to be that, according to Kepler data used by the researchers, systems in which true hot Jupiters have nearby companions are extremely rare. A sample of 45 hot Jupiters (28 of them confirmed) found none with small companions in nearby orbits either closer to the star or more distant. This tends to confirm that these planets migrated to their current orbits, with expected results for the inner system. WASP-47b remains a prominent and problematic outlier.
But here we have to be careful because Huang and company make a crucial distinction between ‘hot Jupiters’ (orbital periods of ten days or less) and ‘warm Jupiters,’ whose orbital periods range from ten days to 200. The paper describes the latter category this way:
…we refer specifically to those giant planets orbiting between 10 days and 200 days in period. Unlike the hot Jupiters (inward of 10 days), they are too far out to have experienced little if any tidal circularization and therefore may be difficult to migrate inward by mechanisms that invoke high-eccentricity excitation. On the other hand, they live inward of the sharp rise of giant planets outside ? 1AU – in fact, the period range of warm Jupiters corresponds to the so-called ’period-valley’, the observed dip in occupation in-between the hot Jupiters and cold Jupiters…
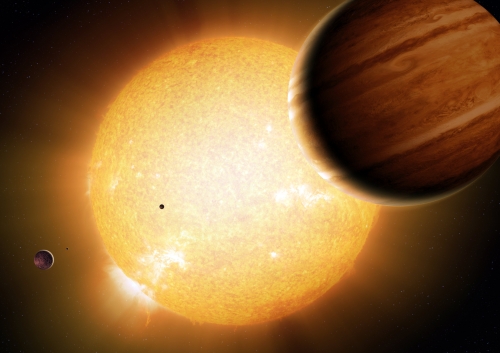
Image: An artist’s portrayal of a Warm Jupiter gas-giant planet in orbit around its parent star, along with smaller companion planets. Credit: Detlev Van Ravenswaay/Science Photo Library.
Warm Jupiters present an entirely different picture than their hot, inner system cousins. In fact, among the researchers’ warm Jupiter sample (27 planets, 12 confirmed), 11 are found to have nearby worlds ranging in size from Earth to Neptune. Most of these companions are inner planets, which is interesting in itself, because outer planets would be less likely to make an observable transit. Hence the data point to outer planets being as common as inner ones. Formation in place seems likely here, a clear distinction between the warm and hot Jupiters:
Motivated by this discovery, and by recent theoretical progress in understanding gas accretion, we propose that a significant fraction of warm Jupiters are formed in situ. The prevalence of multiple low-mass planets in close proximity to one another and to the star can, in a fraction of the cases, permit some of the planets to accrete enough envelope and to trigger run-away growth. This process can operate in the warm Jupiter locale, but appears to become increasingly difficult towards the hot Jupiter region, explaining the rarity of systems like WASP-47b.
Huang speculates that the number of warm Jupiters with small neighboring worlds may encompass half of all such planets, with formation in situ becoming increasingly difficult for closer-in worlds. In this analysis, then, WASP-47b simply becomes the ‘hottest representative of the warm Jupiter population.’ We wind up with hot Jupiters being the result of violent dynamical processes that effectively eliminate (by ejection) nearby inner planets, while those warm Jupiters that form in place are much more benign neighbors and, we can add, interesting places to look for possible moons with habitable conditions on the surface.
Where next with this research? The paper suggests close monitoring of confirmed warm Jupiter systems in hopes of discovering smaller companion worlds. The masses of such planets, inner or outer, could be an interesting clue to the critical mass above which runaway gas accretion occurs. We also need more information about the warm Jupiter population to find out whether there is a second formation process that distinguishes two classes of such worlds.
The paper is Huang, Wu and Triaud, “Warm Jupiters are less lonely than hot Jupiters: close neighbours,” Astrophysical Journal Vol. 825, No. 2 (2016). Abstract / preprint.
A Deeper Look at TRAPPIST-1
Small red stars are drawing increased attention as we continue to discover interesting planets around them. The past two days we’ve looked at the four worlds around K2-72, a red dwarf about 225 light years out in the constellation Aquarius. That two of these worlds have at least the potential for liquid water on the surface makes the system a prime target for further study. Now we return to another recently discussed system of note, TRAPPIST-1.
Designated 2MASS J23062928-0502285, this ultracool dwarf is also in Aquarius, though at forty light years, much the closer target. As with K2-72, we have multiple planets here (three), and also like the K2 discovery, TRAPPIST-1 orbits a star small and dim enough to make planet detection easier — a transiting world presents a clear signature and the study of planetary atmospheres is possible through what is known as transmission spectroscopy, wherein light from the star that has passed through the planet’s atmosphere is analyzed.
Today we have a paper in Nature from an international team including Michaël Gillon (University of Liège) and Julien de Wit (MIT), who have been tightly focused on TRAPPIST-1 for some time. TRAPPIST (TRAnsiting Planets and PlanetesImals Small Telescope) is a 60 cm robotic instrument operated out of Liège, Belgium but sited at the European Southern Observatory’s La Silla Observatory in Chile. The instrument has been studying 70 nearby dwarfs at infrared wavelengths, uncovering the TRAPPIST-1 planets with orbital periods of 1.5 and 2.4 days and an outer world with period not yet well determined.
It was Gillon and de Wit who announced the discovery of the planetary system around TRAPPIST-1 on May 2. The work received a bit of buzz because although the two inner planets are too close to the star to be in the habitable zone, a tidally locked world in these orbits could have regions near the terminator where liquid water could exist. To probe further, the researchers studied data from the Spitzer Space Telescope, allowing them to refine the planetary orbits. At this point, they realized a double transit was in the offing.
Moreover, the event was in a scant two weeks, making for frenzied work, as de Wit explains:
“We thought, maybe we could see if people at Hubble would give us time to do this observation, so we wrote the proposal in less than 24 hours, sent it out, and it was reviewed immediately. Now for the first time we have spectroscopic observations of a double transit, which allows us to get insight on the atmosphere of both planets at the same time.”
The result: A combined transmission spectrum of TRAPPIST-1b and c, meaning the team could analyze the atmospheres of both worlds as the transit occurred. The transmission spectrum was featureless, the data sufficient to show that both transiting planets have relatively compact atmospheres rather than large, gaseous envelopes like Jupiter and Saturn. That would imply rocky planets like the terrestrial worlds — Mars, Earth, Venus — in our own Solar System.
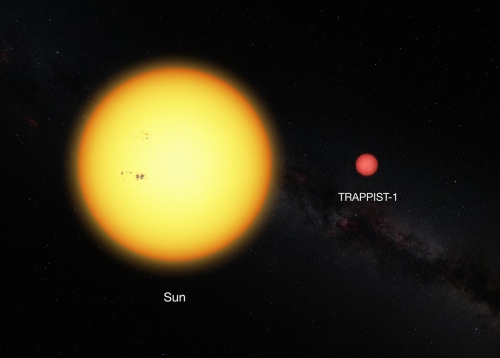
Image: Comparison between the Sun and the ultracool dwarf star TRAPPIST-1. Credit: ESO.
That’s a useful insight because we have no other information about the nature of these planets. Their masses have not been measured, and we have no other data about the kind of planets that can exist around ultracool dwarf stars (TRAPPIST-1 is an M8 dwarf) because the TRAPPIST-1 worlds are our first transiting example.
The excerpt below shows the team’s reasoning, building on the fact that the lack of features in the combined spectrum rules out certain kinds of atmospheres:
…the first observations of TRAPPIST-1’s planets with HST allow us to rule out a cloud-free hydrogen-dominated atmosphere for either planet. If the planets’ atmospheres are hydrogen-dominated, then they must contain clouds or hazes that are grey absorbers between 1.1 μm and 1.7 μm at pressures less than around 10 mbar. However, theoretical investigations for hydrogen-dominated atmospheres predict that the efficiencies of haze and cloud formation at the irradiation levels of TRAPPIST-1b and TRAPPIST-1c should be dramatically reduced compared with, for example, the efficiencies for GJ 1214b… In short, hydrogen-dominated atmospheres can be considered as unlikely for TRAPPIST-1b and TRAPPIST-1c.
Image: The binary transit visualized. Credit: NASA/ESA/STScl.
With an extended gas envelope ruled out, we wind up with a range of possible atmospheres, ranging from the CO2-dominated Venus to an Earth-like atmosphere with heavy clouds or a depleted atmosphere like what we see on Mars. To push further into the possibilities, the team has formed a consortium called SPECULOOS (Search for habitable Planets Eclipsing ULtra-cOOl Stars), the good news being that they are building larger versions of the TRAPPIST instrument in Chile that will focus on the brightest ultracool dwarf stars in the southern hemisphere. Consider the effort an attempt to build the kind of pre-screening tools that our future space telescopes like the James Webb instrument will need for their target list.
The paper is de Wit et al., “A combined transmission spectrum of the Earth-sized exoplanets TRAPPIST-1 b and c,” Nature 20 July 2016 (preprint). The discovery paper is Gillon et al., “Temperate Earth-sized Planets Transiting a Nearby Ultracool Dwarf Star,” published online in Nature 2 May 2016 (abstract). An MIT news release is available.

Follow with RSS or E-Mail
