Centauri Dreams
Imagining and Planning Interstellar Exploration
Cosmic Engineering and the Movement of Stars
Avi Loeb’s new foray into the remote future had me thinking of the Soviet physicist Leonid Shkadov, whose 1987 paper “Possibility of Controlling Solar System Motion in the Galaxy” (citation below) discussed how an advanced civilization could get the Sun onto a new trajectory within the galaxy. Why would we want to do this? Shkadov could imagine reasons of planetary defense, a star being moved out of the way of a close encounter with another star, perhaps.
All of this may remind science fiction readers of Robert Metzger’s novel CUSP (Ace, 2005), which sees the Sun driven by a massive propulsive jet. A more recent referent is Gregory Benford and Larry Niven’s novels Bowl of Heaven (Tor, 2012) and ShipStar (2014), in which a star is partially enclosed by a Dyson sphere and used to explore the galaxy. In 1973, Stanley Schmidt would imagine Earth itself being moved to M31 as a way of avoiding an explosion in the core of the Milky Way that threatens all life (Sins of the Fathers, first published as a serial in Analog).
Loeb’s paper mentions technologies for moving stars because several recent proposals involve this kind of ‘cosmic engineering’ to change civilizational outcomes. The accelerated expansion of the universe will, after the universe has aged by a factor of 10, make all stars outside the Local Group of galaxies disappear as they recede. The process continues with continued acceleration. Wait long enough and we fall prey to cosmic winter, and as Loeb writes:
Following the lesson from Aesop’s fable “The Ants and the Grasshopper,” it would be prudent to collect as much fuel as possible before it is too late, for the purpose of keeping us warm in the frigid cosmic winter that awaits us. In addition, it would be beneficial for us to reside in the company of as many alien civilizations as possible with whom we could share technology, for the same reason that animals feel empowered by congregating in large herds.
There are places where we might do this, says Loeb, and I’ll talk about his ideas on them tomorrow. For today, note that in response to his previous papers on the oncoming ‘cosmic isolation,’ Freeman Dyson proposed to Loeb his own project that would move stars, bringing large-scale formations of stars down to a more manageable volume so that they will be bound by their own gravity. Closely spaced, the stellar collection avoids being dissipated in the accelerated expansion of the cosmos. And it turns out that Dan Hooper (University of Chicago) has also been pondering induced stellar motion, using the energy output of stars to cluster large numbers of them into an astronomically tight radius so that their energies can be harvested.
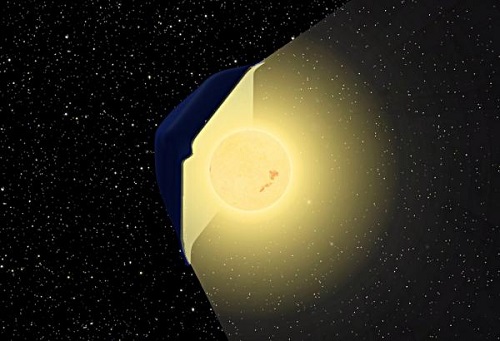
Image: A Shkadov thruster as conceived by the artist Steve Bowers.
Like Dyson and Loeb, Hooper has his eye on the acceleration of cosmic expansion and its consequences. So what kind of ‘stellar engines’ can we envision that could move objects as large as stars? Leonid Shkadov suggested using a star’s radiation pressure. The Shkadov thruster extracts energy from the star by using a vast mirror to take advantage of photon momentum. Let me turn back to an earlier post to reprint a diagram that Duncan Forgan uses in describing a Shkadov thruster. Forgan (University of Edinburgh) points out the difference between these thrusters and Dyson spheres, the latter being spherical and shaped so as to balance gravitational forces on the sphere by way of collecting a maximum amount of stellar energy. But here is the Shkadov thruster as diagrammed by Forgan:
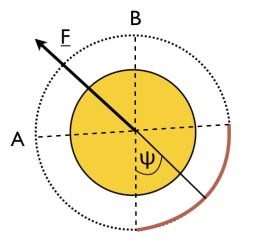
Image: This is Figure 1 from Duncan Forgan’s paper “On the Possibility of Detecting Class A Stellar Engines Using Exoplanet Transit Curves.” Caption: Diagram of a Class A Stellar Engine, or Shkadov thruster. The star is viewed from the pole – the thruster is a spherical arc mirror (solid line), spanning a sector of total angular extent 2ψ. This produces an imbalance in the radiation pressure force produced by the star, resulting in a net thrust in the direction of the arrow. Credit: Duncan Forgan.
Thus the whole idea of the Shkadov thruster is not balance but imbalance. And Forgan goes on to say this about the idea:
In reality, the refected radiation will alter the thermal equilibrium of the star, raising its temperature and producing the above dependence on semi-angle. Increasing ψ increases the thrust, as expected, with the maximum thrust being generated at ψ = π radians. However, if the thruster is part of a multi-component megastructure that includes concentric Dyson spheres forming a thermal engine, having a large ψ can result in the concentric spheres possessing poorer thermal efficiency.
Efficient or not, Shkadov thrusters interest Forgan as a possible SETI detection (Hooper also notes the possibility). Like Dyson spheres, their sheer scale and unusual features could make them visible in a lightcurve, perhaps with the aid of radial velocity follow-ups. Arguing against the idea, though, is the fact that the Shkadov thruster is probably not the technology our hypothetical future civilization would use to move its star (or stars).
I found this out when I wrote Avi Loeb in reaction to his new paper and mentioned the Shkadov idea. Loeb found Dan Hooper’s ideas (in “Life Versus Dark Energy: How An Advanced Civilization Could Resist the Accelerating Expansion of the Universe,” citation below) to be a better solution to the problem. Here is what Loeb told me in our email exchange yesterday:
The use of the momentum associated with the radiation emitted by the star for its propulsion, as envisioned in Shkadov’s thruster, is much less efficient than using the energy associated with same radiation. The radiation momentum equals its energy divided by the speed of light, c. However, the momentum gained by converting this energy to the kinetic energy of a massive object moving at a speed v is larger by a factor of 2(c/v). This is a huge factor of which Dan Hooper is taking advantage to argue that Sun-like stars can reach a percent of the speed light, 0.01c, in a billion years. If he would have used the momentum of the light emitted by the star as in Shkadov’s thruster, then the attainable speed would have been a hundred times smaller, only of order 30 km/s (similar to the speed of chemical rockets), and the journey being contemplated would have not been feasible. During the age of the Universe (10 billion years) one would only be able to traverse a million light years and not leave the Local Group of galaxies. This is not sufficient for gaining more fuel than available within the Local Group of galaxies.
Thus the problem of the Shkadov thruster: By using the momentum of stellar photons, Shkadov loses efficiency. Loeb adds: “One way to improve the efficiency of Shkadov’s thruster (by employing the energy and not the momentum of the star’s radiation) is to harvest the energy from the star through a Dyson sphere and then use it to ablate its surface on one side, generating a rocket effect.” This seems to be what Dan Hooper has in mind in his paper. The civilization in question would harvest the energy of stars through Dyson spheres that, quoting Hooper, “…use the collected energy to propel the captured stars, providing new and potentially distinctive signatures of an advanced civilization in this stage of expansion and stellar collection.”
Hooper has a SETI prospect in mind, while also thinking about collecting sources of energy, maximizing its amount in the form of starlight by a factor of several thousand. It is this prospect that interests Loeb. His paper makes the case that we already have massive reservoirs of fuel in the visible universe in the form of galactic clusters, each containing the equivalent of 1000 Milky Ways. Perhaps, then, we need no star-moving and collection project a la Hooper or Dyson, but rather need to think about reaching a galactic cluster for our fuel. Given the magnitude of that challenge, whether or not we take our home star along is inconsequential.
The speculative buzz I get from this is science fictional indeed. The nearest cluster is Virgo, whose center is some 50 million light years away, with the Coma cluster six times farther still. Thinking in terms of a civilization that could cross such gulfs takes us into Olaf Stapledon territory, a region of spacetime with which I share Loeb’s obvious fascination. I’m running out of time today, but want to look deeper into this with the help of Loeb’s paper tomorrow. I’ll also have more thoughts on ‘stellar engines’ and their origins.
Avi Loeb’s new paper is “Securing Fuel for Our Frigid Cosmic Future” (preprint). Leonid Shkadov’s paper on the Shkadov thruster is “Possibility of controlling solar system motion in the galaxy,” 38th Congress of IAF,” October 10-17, 1987, Brighton, UK, paper IAA-87-613. The Forgan paper is “On the Possibility of Detecting Class A Stellar Engines Using Exoplanet Transit Curves,” accepted at the Journal of the British Interplanetary Society (preprint). The Hooper paper is “Life Versus Dark Energy: How An Advanced Civilization Could Resist the Accelerating Expansion of the Universe” (2018). Preprint.

On Potentially Habitable Moons
Looking through a recent Astrophysical Journal paper on gas giants in the habitable zone of their stars, I found myself being diverted by the distinction between a conservative habitable zone (CHZ) and a somewhat more optimistic one (OHZ). Let’s pause briefly on this, because these are terms that appear frequently enough in the literature to need some attention.
The division works like this (and I’ll send you to the paper for references on the background work that has developed both concepts): The OHZ in our Solar System is considered to be roughly 0.71 to 1.8 AU, which sees Venus as the inner cutoff (a world evidently barren for at least a billion years) and Mars as the outer edge, given that it appears to have been habitable in the early days of the system, perhaps some 3.8 billion years ago. ‘Habitable’ in both HZ categories is defined as the region around a star where water can exist in a liquid state on a planet with sufficient atmospheric pressure (James Kasting has a classic 1993 paper on all this).
The CHZ’s inner edge is considered to be at the ‘runaway greenhouse limit,’ where the breakdown of water molecules by solar radiation allows free hydrogen atoms to escape, drying out the planet at approximately 0.99 AU in our own system. Its outer edge, says the paper:
…consists of the maximum greenhouse effect, at 1.7 AU in our solar system, where the temperature on the planet drops to a point where CO2 will condense permanently, which will in turn increase the planet’s albedo, thus cooling the planet’s surface to a point where all water is frozen (Kaltenegger & Sasselov 2011).
It goes without saying that boundaries like these are going to vary from one planetary system to another, and it’s likewise clear that most of our thinking about habitable zone planets has gone in the direction of small rocky worlds as we mount the search for Earth analogues. What Stephen Kane (University of Southern Queensland), working with an undergraduate student at the university named Michelle Hill as well as colleagues at the University of California, Riverside has done is to identify 121 giant planets in Kepler data that could host habitable moons.
To be sure, the gas giants themselves aren’t considered candidates for life as we know it (though obviously we can’t rule out exotic species adapted to extreme conditions, like Edwin Salpeter’s ‘gasbags,’ free-floating lifeforms that might populate dense atmospheres — see Edwin Salpeter and the Gasbags of Jupiter for more). But the real focus is on those rocky moons that occur in such abundance in our own system.
“There are currently 175 known moons orbiting the eight planets in our solar system. While most of these moons orbit Saturn and Jupiter, which are outside the Sun’s habitable zone, that may not be the case in other solar systems,” says Kane. “Including rocky exomoons in our search for life in space will greatly expand the places we can look.”
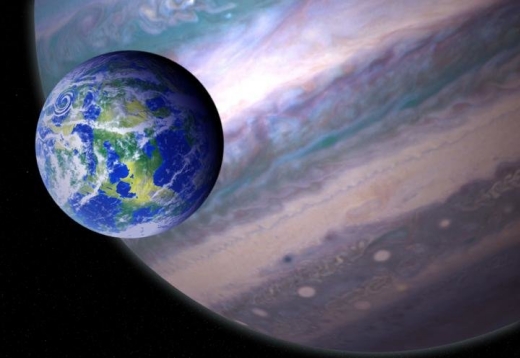
Image: This is an artist’s illustration of a potentially habitable exomoon orbiting a giant planet in a distant solar system. Credit: NASA GSFC: Jay Friedlander and Britt Griswold.
As we consider the different dimensions of habitable zones around other stars, we should also keep in mind the fact that the moons that may emerge in these systems can be as various as our own. Earth’s Moon, for example, seems to be the result of a giant impact early in the system’s formation. Most moons are thought to have formed by accretion within the dust disks around planets, but others can be captured by a planet’s gravitational pull — Triton seems to be an example of this. Thus we could find moons of considerably different composition than their host planet. Considering how many moons we see orbiting our gas giants, the assumption that moons exist around other such worlds in exoplanetary systems seems reasonable.
We still have no exomoon detections, but the search continues, and I always scan the latest papers from the Hunt for Exomoons with Kepler project that David Kipping runs with anticipation, along with those of exomoon theorist René Heller. Having a database of the giant planets we’ve identified thus far as being in the habitable zone of their star may help us target future observations to refine the expected properties of their moons, assuming these exist. Such moons would receive energy from the primary star, of course, but would also receive reflected radiation from the planet they orbit. René Heller has proposed that exomoons in a habitable zone could provide a better environment for life than Earth itself. Let me quote the Hill paper:
Exomoons have the potential to be what [Heller] calls “super-habitable” because they offer a diversity of energy sources to a potential biosphere, not just a reliance on the energy delivered by a star, like earth. The biosphere of a super-habitable exomoon could receive energy from the reflected light and emitted heat of its nearby giant planet or even from the giant planet’s gravitational field through tidal forces. Thus exomoons should then expect to have a more stable, longer period in which the energy received could maintain a livable temperate surface condition for life to form and thrive in.
Discussing the difficulties of exomoon detection, such as the fact that multiple moons around a single planet may eliminate a useful transit timing signal (this is Jean Schneider’s work) and the problems of direct imaging, it’s interesting to see that microlensing remains a candidate. It’s also intriguing to ponder the fate of exomoons, as this paper does, in terms of migrating gas giants and the likelihood that their moons will be lost. We still have much to learn about the movement of giant planets and the effect of their migration upon their own moons as well as other planets.
Once we have a firm exomoon detection, we can begin to characterize the possibilities. As we await improvements in our technology, deepening our knowledge of potential exomoon host planets is the best we can do, and that would begin, as this paper suggests, with radial velocity follow-up observations on gas giant habitable zone candidates like the ones compiled by the authors.
The paper is Hill et al., “Exploring Kepler Giant Planets in the Habitable Zone,” The Astrophysical Journal, 2018; 860 (1): 67. Abstract / preprint. The Kasting paper mentioned above is “Habitable Zones around Main Sequence Stars,” Icarus Vol. 101, Issue 1 (1993), pp. 108-128 (abstract). For René Heller’s work on ‘superhabitable’ moons, see Heller & Armstrong, “Superhabitable Worlds,” Astrobiology January 2014 (preprint). Jean Schneider’s paper on exomoon detection problems is Schneider & Sartoretti, “On the detection of satellites of extrasolar planets with the method of transits,” Astronomy & Astrophysics. Suppl. Ser. Vol. 134, No. 3 (1 February), pp. 553-560 (abstract).
Marc Millis on Mach Effect Thruster, EmDrive Tests
Marc Millis spent the summer of 2017 at the Technische Universität Dresden, where he taught a class called Introduction to Interstellar Flight and Propulsion Physics, a course he would also teach at Purdue University last November. The former head of NASA’s Breakthrough Propulsion Physics project and founding architect of the Tau Zero Foundation, Marc participated in the SpaceDrive project run by Martin Tajmar in Dresden, an effort that has been in the news with its laboratory testing of two controversial propulsion concepts: The Mach Effect Thruster and the EmDrive. Marc’s review comments on modeling for the former were almost as long as Tajmar’s draft paper. Described below, the SpaceDrive project is a wider effort that includes more than these two areas — neither the EmD or MET thruster had reached active test phase during the summer he was there — but the ongoing work on both occupies Millis in the essay that follows.
by Marc Millis

You may have noticed a renewed burst of articles about the EmDrive. What prompted this round of coverage was an interim report, part of the progress on Martin Tajmar’s ‘SpaceDrive’ project to carefully test such claims. Tajmar’s conference paper [citation below] is one of the early steps to check for false-positives. I expect more papers to follow, each progressing to other possibilities. It might take a year or so more before irrefutable results are in. Until then, treat the press stories about certain conclusions as highly suspect.
On Tajmar’s work, this quote from his conference paper:
Within the SpaceDrive project [6], we are currently assessing the two most prominent thruster candidates that promise propellantless propulsion much better than photon rockets: The so-called EMDrive and the Mach-Effect thruster. In addition, we are performing complementary experiments that can provide additional insights into the thrusters under investigation or open up new concepts. In order to properly test the thruster candidates, we are constantly improving our thrust balance facility as well as checking for thruster-environment interactions that can lead to false thrust measurements.
The Mach Effect Thruster is a different approach to the goal of a non-rocket spacedrive, but one that is rooted in unsolved questions in physics where there is a chance for new discoveries. Its theory led to a testable prediction that then evolved into an idea for a propulsive effect.
The unsolved physics question is: “What is the origin of inertial frames?” One attempt to answer that is called “Mach’s Principle” (term coined by Einstein to describe Ernst Mach’s perspective), which is roughly: “inertia here, because of matter out there.” The idea is that the phenomenon of inertia is an interaction between that mass and all the surrounding mass in the universe (presumed gravitational in nature). Jim Woodward picked up on a version of this from Dennis Sciama, and noticed that the inertial mass of an object can fluctuate if its energy fluctuates (think energy in a capacitor). That led to an idea for a propulsive effect by varying the distance between two fluctuating inertias. Unlike the EmDrive, this idea has been in the peer-reviewed literature from the beginning, with some of the more relevant papers being:
Woodward, J. F. (1990). A New Experimental Approach to Mach’s Principle and Relativistic Gravitation, in Foundations of Physics Letters, 3(5): 497-506.
Woodward, J. F. (1991). Measurements of a Machian Transient Mass Fluctuation, in Foundations of Physics Letters, 4(5): 407-423.
Woodward, J (1994), “Method for Transiently Altering the Mass of an Object to Facilitate Their Transport or Change their Stationary Apparent Weights,” US Patent # 5,280,864.
Woodward, J. (2012). Making Starships and Stargates, Springer.
Fearn, H. & Wanser, K. (2014). Experimental Tests of the Mach Effect Thruster. Journal of Space Exploration, 3: 197-205.
Martin Tajmar’s laboratory results can be summarized this way: False positive thrusts were observed under conditions where there should be no thrusting or only minor thrusting. More systematic checks have to be made prior to testing the thrusters at their nominal and maximum operating parameters. The mismatch was more pronounced for the EmDrive than for the Mach Effect Thruster. In both cases it is premature to reach definitive conclusions since this is a work in progress. And if any thrusters do pass all those tests, then more tests will commence to figure out how the thrusters operate (varying conditions to see which affect the thrust levels).
In the case of the EmDrive, only 2 W of the more normal 60 W of power was made available to the thruster. Even at that low power level, thrusts of about 4 µN were observed, which is more than the 2.6 µN expected from the claims from Sonny White’s tests. The more revealing observations were that thrusts were observed when the EmDrive was not supposed to be thrusting. When the EmDrive was pointed to a non-thrusting direction, thrusts were still observed. When the power to the thruster was sent to an attenuator to further reduce the power to the thruster by a factor of 10,000, thrusting at the prior level was still observed.
These observations do not bode well for the EmDrive’s claims of real thrust, but it is too early to firmly dismiss the possibilities. One suspect for the false positive is the interaction with the current to the device and the Earth’s magnetic field, where a current of 2-amps in a few cm of wires can produce a thrust in the µN range. Further tests are planned after adding more magnetic shielding and operating over different power levels.
In the case of the Mach Effect Thruster – which by the way, none of the press articles mentioned – the findings were less pessimistic. Again there were thrusts measured in excess of what was expected for the low power levels (0.6 versus 0.02 µN). Unlike the EmDrive’s mismatch, no thrust was observed when the Mach Effect Thruster was pointed to a non thrusting direction. There was, however, a case where the thrust direction did not change when the thruster direction was flipped. The suspected causes to be further investigated include both magnetic and thermal (expansion) effects.
A word of advice: if you plan to look at Tajmar’s paper. When I tried my usual “rush read” through the paper by reading the abstract and scanning the figures, I misled myself. Read the full text that accompanies the figures to know what you are really looking at. It’s a short article.
Regarding some representative press articles, here is a quick assessment
(1) David Hambling, New Study Casts Doubt on the “Impossible” EmDrive, But this weird propulsion idea isn’t dead yet
This one goes into more detail than the other articles about what was actually done and not done and does link to its information sources. It does not mention the Mach Effect Thruster.
(2) Mike Wall, ‘Impossible’ EmDrive Space Thruster May Really Be Impossible
This one mentions the doubt, but leaves the door open just a bit. Although it does not mention the Mach Effect Thruster also under test, it does at least give a link to the core article and mentions where it came from.
This article talks more about the old claims and expectations than what was really in the new paper. It does not mention the Mach Effect Thruster.
(4) Mike Wehner, NASA’s ‘impossible’ fuel-free engine is actually impossible
More short-hand opinion, and again, no mention of the Mach Effect Thruster.
The takeaway: Science does not proceed by proclamation. Despite what headlines may say, laboratory work is a matter of refining techniques and bringing precision to bear on prior claims. At the moment, evaluation of the EmDrive and Mach Effect thruster continues, with no guarantee that either of these effects may prove genuine, but let’s let the process play out.
The Tajmar paper is Tajmar et al., “The SpaceDrive Project – First Results on EMDrive and Mach-Effect Thrusters,” presented at the Space Propulsion 2018 conference in Seville, Spain (full text).
Enter the ‘Clarke Exobelt’
It’s interesting to consider, as Hector Socas-Navarro does in a new paper, the various markers a technological civilization might leave. Searching for biosignatures is one thing — we’re developing the tools to examine the atmospheres of planets around nearby stars for evidence of life — but how do we go about looking for astronomical evidence of a technological society, one found not by detection of a directed radio or laser beacon but by observation of the stars around us?
Various candidates have been suggested, the most famous being the Dyson sphere, in which an advanced civilization might choose to trap the energy output of its entire star, and we’re in the era of searches for such objects, as witness the Glimpsing Heat from Alien Technologies effort at Penn State. But there are many other suggestions, ranging from detecting antimatter used for power or propulsion, analyzing Fast Radio Bursts for evidence of manipulation as a propulsion system, and looking at depletion of metals in a stellar disk (asteroid mining).
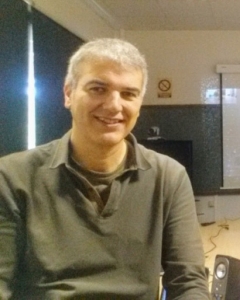
Image: Astronomer Hector Socas-Navarro (Instituto de Astrofísica de Canarias). Credit: IAC.
What Socas-Navarro has in mind is a technology we have already begun to deploy and will presumably see in accelerated use. Delightfully, he has named his idea ‘the Clarke Exobelt’ (CEB) in a nod to the father of the communications satellite, an apt choice given that he defines the idea as the collection of objects, including non-functional ones, in geostationary and geosynchronous orbits around a planet. An astronomer at the Instituto de Astrofísica de Canarias, Socas-Navarro believes that because there is no natural ‘preference’ for this orbit, the detection of a population of objects within it would be highly suggestive of an artificial origin.
Published in The Astrophysical Journal, the paper has caught the eye of enough Centauri Dreams readers that I have five copies of it in my inbox. Seeing the Clarke name associated with it is enough to pique my interest — would that we had Sir Arthur’s own thoughts on the matter! Socas-Navarro points out that there is a certain economy in searching for Clarke Exobelt objects, in that current techniques to detect exoplanets and exomoons should also be able to detect a large enough cluster of technologies in geosynchronous orbits.
The paper, then, is a suggestion that we begin looking for this kind of technosignature amongst the other possibilities. The challenge is in the extrapolation, for to be detectable with our current and near-future technologies, such an Exobelt would have to be densely populated. Our own Clarke belt is relatively sparse, with two-thirds of existing satellites in low orbits. Socas-Navarro believes, however, that the realm of geostationary and geosynchronous satellites is destined to grow, and his simulations show that if it does, it will at some point become detectable:
The geostationary orbit, often named after Clarke, who explored its practical usefulness for communication purposes (Clarke 1945), is specially interesting because satellites placed there will remain static as seen from the ground reference frame. However, the available space in that orbit is limited. A moderately advanced civilization might eventually populate it with a relatively high density of objects, making it advisable (cheaper in a supply-and-demand sense) to use geosynchronous orbits when possible for those satellites whose requirements are less strict and allow for some degree of movement along the North-South direction on the sky. Over time, one might expect that societal needs would eventually drive an increase of object density in a band around the geostationary orbit, forming a CEB.
Using Earth’s current satellite population as a reference, the author creates a Clarke Exobelt model using as parameters radius, width, face-on opacity and inclination of the equatorial plane with respect to the plane of the sky (a CEB viewed edge-on would have an inclination of 90 degrees). The model excludes eccentric orbits and assumes all objects at the same orbital altitude. Using it, Socas-Navarro explores a Clarke Exobelt as it appears in the light curve of a star.
Our current Clarke belt would be orders of magnitude below the detection threshold for observers around other stars if they were using technologies similar to ours. Socas-Navarro argues that the Clarke belt around Earth is showing exponential growth, such that extrapolating it into the future would make it visible to other-world observers by the year 2200. The author considers this a reasonable extrapolation, though one highly dependent on future technology choices including, for example, space elevator systems, which could dramatically change access to these orbits and accelerate the emergence of a detectable signature.
As I read the Socas-Navarro paper, I was struck by its reliance on finding a civilization in a state of development close to our own. He is quite clear on this, saying his intention is “to explore the consequences of a direct extrapolation of our current trends,” acknowledging that even in our own near-future, we may take a different route in the population of our own Clarke belt.
Thus far, searches for technosignatures have assumed advanced technologies of the sort needed to dismantle planets and build Dyson spheres, although there is some discussion of atmospheric change through pollution or other civilizational activities. Despite the odds against finding a civilization just at the stage when it relied heavily on a Clarke Exobelt to maintain its essential services, the author thinks it prudent to keep our eyes open for this technosignature because of the deep uncertainties of forecasting what far more advanced cultures would do.
And we are improving the methods that might help us find such a Clarke Exobelt, even though they are not fine-tuned for such. Noting the difficulty of distinguishing between a CEB and a natural planetary ring system, the paper adds this:
While the similarity between a CEB and a ring system poses an initial difficulty, it also opens new opportunities. Existing interest in the physics of exorings and exomoons means that large efforts will be devoted in future photometric missions to examine rocky planet transits for evidence of such objects. This paper shows how future positive detections of orbital material may be further scrutinized for evidence of CEBs, making the search for moderately advanced technologies “piggyback” on such missions.
Thus we have a technosignature to add to our roster. One thing finding a CEB would imply is a still-functioning civilization — active maintenance would be required to keep objects in a crowded CEB within their proper orbits over long time-periods — which could not necessarily be said of a detected Dyson sphere, conceivably a relic of a long-dead culture. CEB detection is, as the author acknowledges, a ‘long shot.’ But having the widest range of technosignatures examined in the literature is only prudent. After all, who knows what we’ll find next?
The paper is Socas-Navarro, “Possible Photometric Signatures of Moderately Advanced Civilizations: The Clarke Exobelt.” The Astrophysical Journal Vol. 855, No. 2 (13 March 2018). Abstract / Preprint.
On Those Ceres Organics
I set off an interesting conversation with a neighbor when organic material was detected on Ceres, as announced last year by scientists using data from the ongoing Dawn mission. To many people, ‘organics’ is a word synonymous with ‘life,’ which isn’t the case, and straightening that matter out involved explaining that organics are carbon-based compounds that life can build on. But organic molecules can also emerge from completely non-biological processes.
So with that caveat in mind about this word, it’s still interesting that organics appear on Ceres, especially since water ice is common there, and we know of water’s key role in living systems. A new paper looks again at data from Dawn, whose detections were made with infrared spectroscopy using its Visible and Infrared (VIR) Spectrometer. The instrument, examining which wavelengths are reflected off Ceres’ surface and which are absorbed, detected organic molecules in the region dominated by Ernutet Crater on Ceres’ northern hemisphere.
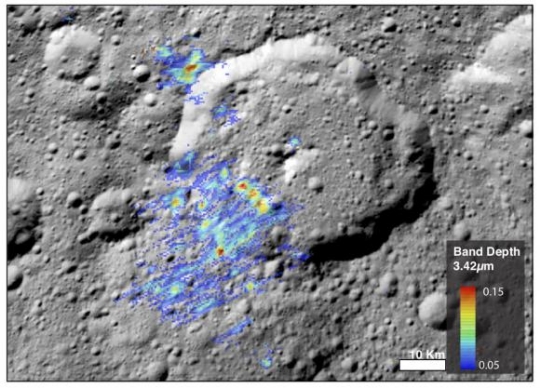
Image: Last year, the Dawn spacecraft spied organic material on the dwarf planet Ceres, largest denizen of the asteroid belt. A new analysis suggests those organics could be more plentiful than originally thought. Credit: NASA / Rendering by Hannah Kaplan.
The paper’s lead author is Hannah Kaplan, now a postdoc at the Southwest Research Institute. What Kaplan and team did was to contrast the Dawn data with laboratory spectra from both terrestrial and extraterrestrial organic materials, the latter derived from meteorites. Comparing these materials with known composition, the researchers looked anew at the Ceres spectra to gain a better picture of their composition and abundance. This analysis could help us make the call on the origin of these organics, whether natural to Ceres or delivered by an impactor.
When they contrasted the VIR data from Ceres with the laboratory reflectance spectra of organic materials formed on Earth, the scientists found that between 6 and 10 percent of the spectral signature on Ceres could be explained by organic material. But folding in comparisons with organic material from carbonaceous chondrite meteorites, the team found a spectral reflectance that differed from the terrestrial.
“What we find is that if we model the Ceres data using extraterrestrial organics, which may be a more appropriate analog than those found on Earth, then we need a lot more organic matter on Ceres to explain the strength of the spectral absorption that we see there,” Kaplan said. “We estimate that as much as 40 to 50 percent of the spectral signal we see on Ceres is explained by organics. That’s a huge difference compared to the six to 10 percent previously reported based on terrestrial organic compounds.”
As to the question of origins, the impact theory would seem to favor a cometary solution, comets being known to display higher abundances of organics than asteroids. The accompanying problem here is that a cometary impact would produce enough heat to destroy such organics. On the other hand, formation on Ceres itself is problematic, because other than the small patches in the northern hemisphere region already noted, organics do not appear.
“If the organics are made on Ceres, then you likely still need a mechanism to concentrate it in these specific locations or at least to preserve it in these spots,” said Ralph Milliken, an associate professor in Brown University’s Department of Earth, Environmental and Planetary Sciences and a study co-author. “It’s not clear what that mechanism might be. Ceres is clearly a fascinating object, and understanding the story and origin of organics in these spots and elsewhere on Ceres will likely require future missions that can analyze or return samples.”
Thus a major lesson: The results depend on what kind of organic material you use to make sense of the Ceres data. The comparison with extraterrestrial organics seems sensible, and it’s one we’ll doubtless invoke again as we move toward upcoming asteroid encounters. It’s worth noting in that regard that Kaplan has recently joined the teaming operating OSIRIS-REx. The spacecraft will arrive at asteroid Bennu in August of this year, while the Japanese Hayabusa 2 is expected to reach asteroid Ryugu in a matter of weeks.
The paper is Kaplan et al., “New Constraints on the Abundance and Composition of Organic Matter on Ceres,” Geophysical Research Letters 21 May 2018 (abstract).
Protoplanets: The Next Detection Frontier
Some 4 million years old, the star HD 163296 is about 330 light years out in the direction of the constellation Sagittarius. When dealing with stars this young, astronomers have had success with data from the Atacama Large Millimeter/submillimeter Array (ALMA), teasing out features in protoplanetary disks filled with gas and dust, the breeding ground of new planets. As seen below, the ALMA imagery can be striking, a closeup look at a stellar system in formation.
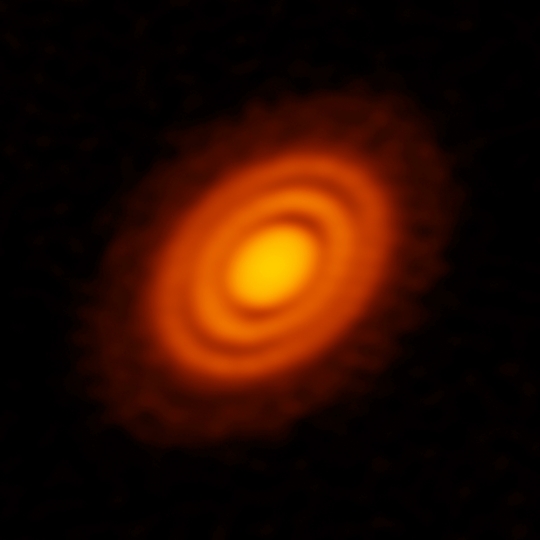
Image: ALMA image of the protoplanetary disk surrounding the young star HD 163296 as seen in dust. Credit: ALMA (ESO/NAOJ/NRAO); A. Isella; B. Saxton (NRAO/AUI/NSF).
Tantalizingly, ALMA can show us rings in such disks, and the gaps that imply an emerging planet. But how do we know we’re actually looking at planets, rather than other phenomena we’re only now learning how to detect in such disks? New work from Richard Teague (University of Michigan) as well as a second effort by Christophe Pinte and team (Monash University, Australia) points us strongly toward the protoplanet interpretation. Both papers are in process at Astrophysical Journal Letters and available as preprints (see below).
In each case, the focus is not on the dust that is so visible in the image above but the distribution of carbon monoxide (CO) gas throughout the HD 163296 disk structure. ALMA is able to detect the millimeter-wavelength light that molecules of CO emit, while wavelength changes owing to the Doppler effect make it possible to discern the movement of the gas within the disk. Calling the precision involved in these studies ‘mind boggling,’ Teague coauthor Til Birnstiel (University Observatory of Munich) notes that in a system where gas rotates at about 5 kilometers per second, ALMA detected velocity changes as small as a few meters per second.
“Although dust plays an important role in planet formation and provides invaluable information, gas accounts for 99 percent of a protoplanetary disks’ mass,” says Teague coauthor Jaehan Bae of the Carnegie Institute for Science. “It is therefore crucial to study kinematics of the gas.”
Teague and team found disruption in the Keplerian rotation that gas would be expected to show, the orderly motion of objects around a central star. The emergence of localized disturbances within the gas would provide evidence for a planet in the making. And indeed, the researchers found two distinct patterns, one at roughly 80 AU, the other at 140 AU. Meanwhile, the team led by Christophe Pinte — likewise looking at anomalies in the flow of gas through detection of CO emissions rather than dust — detected a third planet-like pattern, this one at 260 AU. All three worlds, the scientists calculate, would be approximately similar in mass to Jupiter.
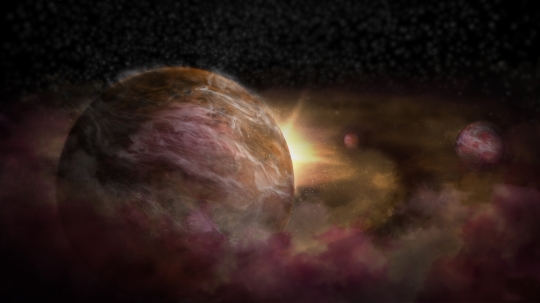
Image: Artist impression of protoplanets forming around a young star. Credit: NRAO/AUI/NSF; S. Dagnello.
We’re out on the edge here, just as exoplanet hunting itself was in the early 1990s as we approached the first detections. These days we can use radial velocity, transits and gravitational microlensing to spot planets, with the number of confirmed worlds rising steadily. Protoplanets are another story altogether, although the evidence for them continues to mount. The Teague paper explains the significance of the CO studies:
We have presented a new method which enables the direct measurement of the gas pressure profile. This allows for significantly tighter, and more accurate, constraints on the gas surface density profile than traditional methods. Furthermore, as this method is sensitive to the gap profile, it provides essential information about the gap width in the gas which is typically poorly constrained from brightness profiles.
And indeed, what the work gives us is a way to measure changes in the gas velocity and density that correlate to the observed perturbations in the protoplanetary disk. Pinte’s team, meanwhile, working with measurements of CO velocity in the disk, found a 15 percent deviation from expected Keplerian flow. The possible protoplanet they detect at approximately 260 AU could conceivably be detected via direct imaging. If it is, the question of its formation is interesting:
Can massive planets form at a distance of 250 au from the star? The location of giant planets in the outer regions of discs would be broadly consistent with gravitational instability. On the other hand, the timescale for core accretion may also be reasonable given that HD 163296 is a relatively old disc (≈ 5 Myr). The planet may also have undergone outward migration, depending upon the initial profile of the disc. It is beyond the scope of this Letter to speculate further.
Measuring the velocity of carbon monoxide in a protoplanetary disk is an indication of how fine-grained the ALMA data on HD 163296 are. The comparison of these observations with computer models show a fit with the patterns that would be expected for young planets. The evidence is not yet conclusive, but it’s clear that the developing science of protoplanet detection is gaining traction. Applying these methods to other well-defined disks should tell us more.
The papers are Teague et al., “A Kinematic Detection of Two Unseen Jupiter Mass Embedded Protoplanets” (preprint) and Pinte et al., “Kinematic evidence for an embedded protoplanet in a circumstellar disc” (preprint), both accepted at Astrophysical Journal Letters.

Follow with RSS or E-Mail
