Centauri Dreams
Imagining and Planning Interstellar Exploration
A KBO-like Object around another Star?
We’re beginning to find evidence of objects like those in the Kuiper Belt beyond our own solar system. In this case, the work involves a white dwarf whose atmosphere has been recently polluted by an infalling object, giving us valuable data on the object’s composition. The work involves the white dwarf WD 1425+540, whose atmosphere has been found to contain carbon, nitrogen, oxygen and hydrogen. The findings are unusual because white dwarfs are the dense remnants of normal stars, with gravitational fields strong enough to pull elements like these out of their atmospheres and into their interiors, where they are immune from detection by our instruments. And that implies a relatively recent origin for these elements.
Lead author Siyi Xu (European Southern Observatory) and team worked with spectroscopic observations from HIRES (the High Resolution Echelle Spectrometer) on the Keck Telescope and included data from the Hubble instrument. The researchers believe the white dwarf’s atmosphere has been enriched by the breakup and eventual spiral into the star of a minor planet, whose composition mimics what we find in Kuiper Belt objects. WD 1425+540, some 200 light years away in the constellation Boötes, thus absorbed a body that is calculated to have been composed of 30 percent water and other ices and 70 percent rocky material.
The event, which would have involved the gravitational disruption of the object’s orbit, causing its infall, disintegration and the eventual absorption of its elements by the star, may have occurred as recently as 100,000 years ago. We could be seeing a process that has implications for the existence of life on planets in the inner system like our own. The Earth may well have been dry when it first formed, with life’s building blocks delivered as the result of collisions with other objects. Siyi Xu sees this as a process that can occur anywhere:
“Now we’re seeing in a planetary system outside our solar system that there are minor planets where water, nitrogen and carbon are present in abundance, as in our solar system’s Kuiper belt. If Earth obtained its water, nitrogen and carbon from the impact of such objects, then rocky planets in other planetary systems could also obtain their water, nitrogen and carbon this way. We would like to know whether in other planetary systems Kuiper belts exist with large quantities of water that could be added to otherwise dry planets. Our research suggests this is likely.”

Image: Rendering of a white dwarf star (bright white spot), with rocky debris from former asteroids or a minor planet that has been broken apart by gravity (red rings). Credit: University of Warwick.
Temperatures in the protoplanetary disk of our own system are thought to have determined the distribution of water, with dry rocky worlds inside the snow line, and water ice available beyond it, much of it still to be found in asteroids, comets and Kuiper Belt objects. Nitrogen ice can also be found in comets from the outer regions of the Kuiper Belt and in the Oort Cloud. The assumption has been that similar conditions prevailed around other stars, but our knowledge of analogs to Kuiper Belt objects in other systems has remained scant.
This makes white dwarfs like WD 1425+540 a useful tool, for the detection of heavy elements in their atmosphere has to point to an external source, giving us a way to measure the broad composition of objects in the system. And indeed, the paper notes that there are at least a dozen ‘polluted’ white dwarfs whose accreted material has been measured in detail. Excess oxygen that can be attributed to water-rich objects has been detected in only three.
From the paper:
The accreting material observed in WD 1425+540 provides direct evidence for the presence of KBO analogs around stars other than the Sun. In addition, WD 1425+540 has a K dwarf companion at 40.0 arcsec (2240 au) away (Wegner 1981). The presence of a distant stellar companion can impact the stability of extended planetary systems and, thus, enhance the chances of perturbing objects – that initially orbit far from a white dwarf – into its tidal radius via the Kozai-Lidov mechanism (Zuckerman 2014; Bonsor & Veras 2015; Naoz 2016).
Interestingly, the authors have worked parameters for the disrupted object in the system. When it was on the main sequence, WD 1425+540 would have been about twice as massive as the Sun and 10 times more luminous. Its nitrogen-bearing KBO analogs would have been found at about 120 AU, or three times further from the star than the Sun’s Kuiper Belt objects. Add in the star’s red giant phase and its Kuiper Belt moves out by a factor of 3. Thus the object that was accreted by WD 1425+540 likely orbited beyond 300 AU before experiencing the gravitational disruption that drove it inward toward the star and its eventual destruction.
Most material accreted onto white dwarfs in previous studies of polluted atmospheres has come from dry minor planets. This paper argues that the spectroscopic work on WD 1425+540 gives us strong evidence for volatile-rich planetesimals around other stars:
With this new dataset, we can conclude that extrasolar terrestrial planets could have volatile element and water abundances provided by KBO analogs that are comparable to those on Earth.
The paper is Xu et al., “The Chemical Composition of an Extrasolar Kuiper-Belt-Object,” Astrophysical Journal Letters 836, L7 (2017). Abstract / preprint.

NASA Report on Europa Lander
With an ocean containing twice as much water as Earth’s oceans, Europa is a high-priority target for astrobiology. But the presence of water alone is not what gives the Jovian moon such interest. After all, we’re learning that icy worlds beyond the snowline can feature oceans beneath the surface, and we’re learning more all the time about oceans all the way into the Kuiper Belt, as the ongoing investigation into what lies beneath Pluto continues.
But Europa, like Enceladus, offers us substantial water in direct contact with a rocky seafloor, and that’s a telling circumstance. What excites astrobiologists is water in the presence of the organic compounds that can become components of biology. The third factor is energy, which Europa has in abundance thanks to the tidal pull of Jupiter, causing flexing of the seafloor that may well be driving hydrothermal activity. Chemical compounds produced from interactions with Jupiter’s magnetic field may also be useful as an energy source.
In June of 2016, NASA’s Planetary Science Division began an early study into a Europa lander. Having a lander here is an exciting thought because study of Europa’s surface shows the periodic breakthrough of oceanic materials that then re-freeze, icy plates that spread apart during this process and so-called ‘chaos’ terrain that may contain frozen material from the interior. A lander here could tell us much about what lies under Europa’s frozen crust.

Image: Enhanced-color image mosaic from Galileo showing crosscutting lineae, multiple wide, dark bands where the surface has spread apart (right), and chaos regions (left) where the surface has been disrupted into blocks of material. Image is approximately 200 km wide. Solar illumination is from the upper left. Credit: Figure 1.1 of the SDT report.
The Europa lander work is in its infancy. This is a Science Definition Team report that, as this JPL news release explains, is a routine part of any mission, used to work out the feasibility and scientific value of the concept. The team’s report, involving 21 scientists, was submitted to NASA on February 7. Its goals: To characterize the surface and subsurface of the Jovian moon, supporting future robotic exploration; to assess the habitability of the moon by analyzing its surface; and — the primary goal — to search for evidence of life.
We haven’t developed a full-blown life detection strategy since the days of the Viking landers on Mars, so it’s heartening to see the emergence of a document that makes recommendations on the scientific instruments required and analyzes the systems needed for landing here. We need to get a payload onto the surface without benefit of heat shields or parachutes, given the lack of an atmosphere, and it’s hard to see how this could be done with missions like the current multiple flyby mission scheduled for launch in the 2020s.
That mission is separate from the concept lander now being considered, but it gives food for thought. Flybys, of which the former mission includes at least 45, will be profoundly useful in imaging the moon’s surface at high resolution and investigating its composition. But multiple high-speed flybys make it challenging to slow a lander for safe arrival on the surface. The lander report, therefore, takes a different route, using gravity assists within the Jovian system — at Callisto and Ganymede — to reduce velocity relative to Europa. From the report:
The first Europa gravity assist would mark the beginning of the final mission phase before landing, and the spacecraft would now be exposed to much higher daily radiation doses than before. The first Europa gravity assist would be designed to insert the spacecraft into a Europa-resonant orbit, and ΔV-leveraging maneuvers would further reduce the spacecraft’s velocity relative to Europa (Campagnola and Russell, 2010). This velocity reduction would make the low-energy (or three-body) regime accessible to the spacecraft, in which the gravitational interplay of Europa and Jupiter would enable the carrier to reside in the vicinity of Europa for the full duration of the surface mission. This final part of the tour trajectory, from first Europa flyby to landing, would take approximately one month and would set up the lander delivery to a 5 km periapsis altitude at a target state relative to the landing site.
Image: Example tour trajectory showing a Jupiter arrival and transition to Europa. Credit: Figure 10.5 of the SDT report.
After that, we have deorbit and landing, as pictured below.
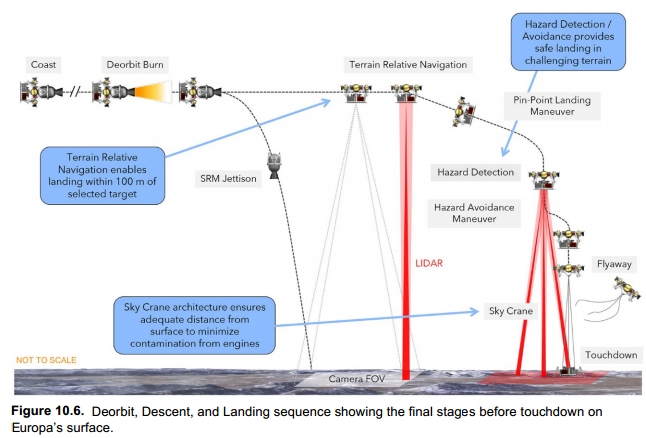
Image: Deorbit, descent and landing sequence showing the final stages before touchdown on Europa’s surface. Credit: Figure 10.6 from the SDT report.
This is tricky business, using tethers to lower the lander from the descent stage in a ‘sky crane’ configuration before touchdown, with the descent stage impacting at a safe distance from the lander:
Prior to touchdown, the lander stabilizers would be deployed. As the lander is set onto the terrain, the stabilizer legs would contract as needed to both maintain contact with the ground and enable the lander body to remain flat. Contact of the lander body with the surface would trigger release of the bridle. The stabilizers would then be locked in position to yield a stable lander configuration for science operations.
The Europa lander report will be discussed at two upcoming meetings designed to get feedback from the scientific community. The first, on March 19, occurs at the 2017 Lunar and Planetary Science Conference in Texas. The second, on April 23, will take place at the Astrobiology Science Conference (AbSciCon) in Arizona. As early in the game as this is, The Europa Lander Study 2016 Report (JPL D-97667) makes for absorbing reading, and I recommend downloading and reading it on a tablet for convenience.
Dr. Andy Aldrin joins Tau Zero Foundation team as Chief Strategist
The Tau Zero Foundation, a non-profit foundation dedicated to developing the capability for interstellar robotic exploration and human travel, has selected Dr. Andrew Aldrin as chief business strategist on our board of directors. In this role he will provide pragmatic objectivity, and insight while advocating for the nonprofit’s mission.
“The frequency of the discovery of exo-planets around the nearby stars to the Sun highlights the importance of our mission,” said Rhonda Stevenson, president and CEO of Tau Zero Foundation. “We invited Dr. Aldrin to join the Foundation’s board because his retained objectivity and pragmatic approach will be helpful to narrowing our focus to the development of technologies with the greatest potential for practical application in the near future. As a space industry veteran with an exceptional talent for strategic management and assimilating advanced technology concepts into viable programs, Dr. Aldrin brings immeasurable value to our Foundation, and we are very excited to have him on our team.”

Dr. Andrew Aldrin currently serves as the Director of the Buzz Aldrin Space Institute (BASI) and is an Associate Professor at Florida Institute of Technology. BASI is a multidisciplinary institute created to advance space exploration and development toward the goal of establishing and maintaining a permanent human presence on Mars. Prior to FIT, Dr. Aldrin was President of Moon Express, responsible for day-to-day operations for the company. Prior to coming to Moon Express, Dr. Aldrin was Director of Business Development and Advanced Programs at United Launch Alliance where he oversaw development of corporate strategies, business capture, senior customer relations and advanced program development for civil space markets. Before ULA, Dr. Aldrin headed Business Development and Advanced Programs for Boeing’s NASA Systems, and Launch Services business units. He has also served as a Resident Consultant at the RAND Corporation and Professional Research Staff Member at the Institute for Defense Analyses. Dr. Aldrin holds a Ph.D. in Political Science from UCLA, an MBA from TRIUM, a MA in Science Technology and Public Policy from The George Washington University, and a MA in International Relations from the University of California at Santa Barbara. He is an Adjunct Faculty member at International Space University and has been Adjunct Faculty at the University of Houston and California State University at Long Beach. He has served as ShareSpace Vice Chairman since its inception in 1998.
About the Tau Zero Foundation
Tau Zero is a 501(c) non-profit organization dedicated to accelerating progress toward the scientific breakthroughs required to support interstellar flight. The Foundation’s efforts, driven by the experts most capable of addressing the formidable challenges of interstellar flight, include fundamental scientific research, encouraging and supporting academic involvement in sciences related to its goals, empowering youth in this quest, forging collaborations for cross-fertilization, and engaging governmental and industry support on a global scale.
Tau Zero’s motto is Ad Astra Incrementis – to the stars in ever-expanding steps.
Tightening the Parameters for Centauri A and B
When it comes to the nearest stars, our focus of late has been on Proxima Centauri and its intriguing planet. But of course the work on Centauri A and B continues at a good clip. The prospects in this system are enticing — a G-class star like our own, a K-class dwarf likewise capable of hosting planets, and the red dwarf Proxima a scant 15000 AU away. Project Blue examines how we might image planets here as our radial velocity studies proceed.
But we have much to learn, and not just about possible planets. A new paper by Pierre Kervella (Observatoire de Paris), working with Lionel Bigot and Fréderic Thévenin (both at the Observatoire de la Cote d’Azur), reminds us of the importance of firming up our stellar data.
We need to learn as much as possible about Centauri A and B not just because we’d like to find planets there but also because the work has implications for space missions, including the ESA’s Gaia, which will tighten our distance measurements to many stars. The Alpha Centauri stars are important benchmarks for Gaia, putting the emphasis on an accurate calibration of the basic stellar parameters in this system.
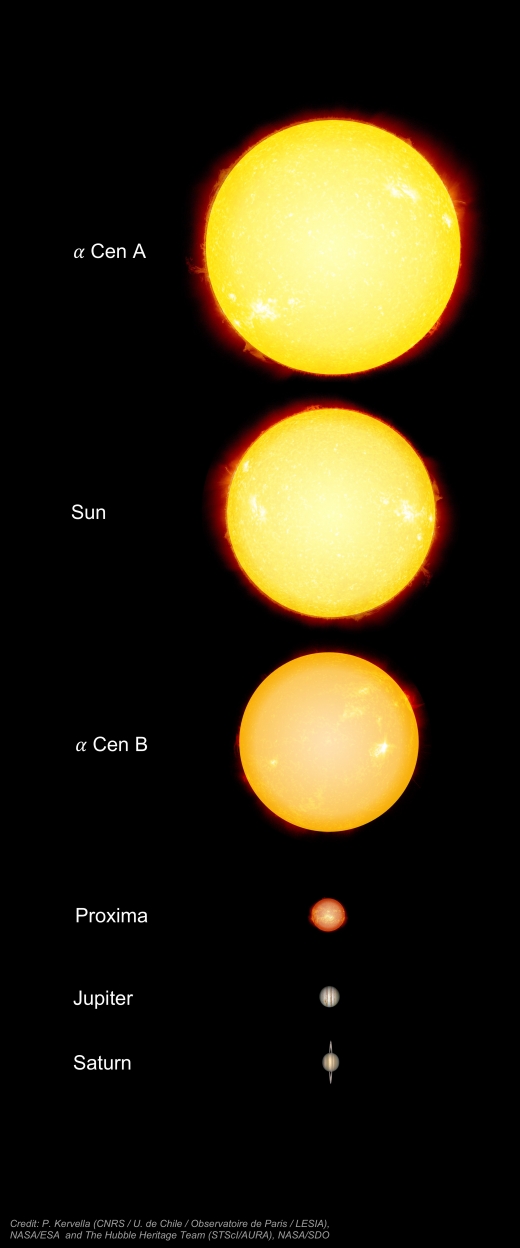
Image: The Alpha Centauri stars in comparison to our Sun and other Solar System objects. Credit: Pierre Kervella.
Kervella and team have used new observations of Centauri A and B with the Very Large Telescope Interferometer equipped with the PIONIER (Precision Integrated Optics Near-infrared Imaging ExpeRiment) beam combiner to operate in the near infrared. Their paper reports on improved measurements of both stars’ angular diameters in relation to the phenomenon known as limb darkening. The latter results point to the need to improve our models as we study the photospheres of stars including our own Sun.
Limb darkening refers to the gradual decrease in brightness that we see as we look away from the center of a star toward its outer edge, or limb. Have a look at the image below to see the effect, which is easily visible in photographs of the Sun. When we look at the center of the Sun’s disk, we see the greatest light emission because we are viewing the deepest, and hottest layers, while at the limb, we are seeing only cooler layers that produce less light.
The phenomenon is important because we can use it to study how a star’s atmosphere is structured, but it turns up as a factor in everything from eclipsing binary stars to gravitational microlensing. Moreover, limb darkening will affect the shape of the transit curve produced by a planet moving in front of its star. The planet blocks a smaller part of the star’s light when it is near the limb, and a greater fraction as it moves toward the center of the star. The center of a transit, in other words, is always going to be deeper than the edges, something that would not happen if a star had a uniform brightness (there the transit ‘curve’ would appear flat).
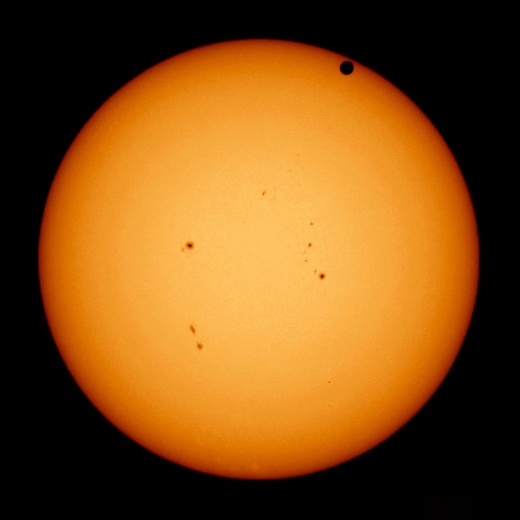
Image: A filtered image of the Sun in visible light, showing the limb-darkening effect as a dimmer luminosity towards the edge or limb of the solar disk. The image was taken during the 2012 transit of Venus (seen here as the dark spot at the upper right). Credit: Brocken Inaglory / Wikimedia Commons.
What the researchers find is that there is a discrepancy between the measured limb darkening parameters and the models previously discussed in the literature — these overestimate limb darkening for both Centauri A and B. While the difference is small and does not affect the team’s measurements of the stars’ angular diameter, the limb darkening models need adjustment, a problem that is not limited to Alpha Centauri. From the paper:
This implies that the underlying atmosphere models deviate from the real intensity profiles of α Cen, and we note that similar discrepancies are observed on the Sun. The observed discrepancies indicate that the predictive accuracy of the current generation of model atmospheres may be significantly lower than expected. This is likely to be more critically the case for stars with parameters that are very different from those of the Sun (e.g., cooler stars with molecular envelopes) and for wavelength regions more complex to model than the near-infrared (e.g., the ultraviolet and visible).
Our interest in cooler stars like Proxima Centauri, and the useful transit depths that could be observed with exoplanets around nearby red dwarfs mean we need as accurate a limb darkening model as possible in order to measure their transits precisely. These observations for Centauri A and B also offer us benchmarks we can use to firm up our atmospheric models for more distant stars.
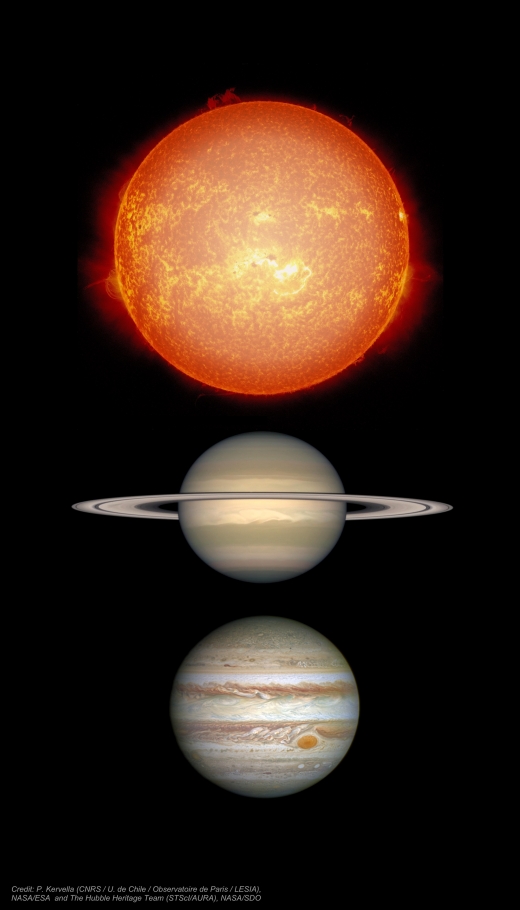
Image: Proxima Centauri in relation to familiar objects in our own system. Credit: Pierre Kervella.
Meanwhile, the radii of Centauri A and B are shown to line up with earlier work. For Centauri A, we get a radius of 1.2234 ± 0.0013 ± 0.0051 R☉ (where R☉ is the radius of the Sun). Centauri B yields 0.8632 ± 0.0009 ± 0.0036R☉. As the paper notes, “Together with the parallax and masses recently reported by Kervella et al. (2016), as well as spectroscopic studies, the determined radii complete the calibration of the fundamental parameters of both components of α Centauri.”
The paper is Kervella, Bigot and Thévenin “The radii and limb darkenings of α Centauri A and B: Interferometric measurements with VLTI/PIONIER,” Astronomy & Astrophysics 597, A137 (2017). Abstract / preprint.
A New Look at Habitability around Red Dwarf Stars
We’ve looked at the factors that are problematic for life around red dwarf stars for some time now, focusing on tidal lock (in which one side of the planet always faces the star) and stellar flare activity, which could dramatically affect life on the surface. A new paper from Vladimir Airapetian (NASA GSFC) and colleagues homes in on the latter problem, offering the idea that we should re-shape our notion of the habitable zone to include space weather.
A planet in the habitable zone of any kind of star, according to the definition used most commonly today, is one on which liquid water could exist on the surface. But is this painting the habitable zone with too broad a brush? Because if we allow X-ray and extreme ultraviolet emissions into the picture — these are common on red dwarf stars, and especially on younger ones — then even clement temperatures at a planetary surface may not be enough.
The problem: Stellar eruptions like flares and, in their most extreme form, coronal mass ejections, may degrade the atmosphere of nearby planets. This is bad news for planets around M-dwarfs, because to be in the habitable zone in terms of surface temperatures around these small stars, they must orbit in relatively close proximity. The Airapetian model takes note of the effect, as the lead author of the paper on this work notes:
“When we look at young red dwarfs in our galaxy, we see they’re much less luminous than our sun today,” Airapetian said. “By the classical definition, the habitable zone around red dwarfs must be 10 to 20 times closer-in than Earth is to the sun. Now we know these red dwarf stars generate a lot of X-ray and extreme ultraviolet emissions at the habitable zones of exoplanets through frequent flares and stellar storms.”
None of this is news to those who have been tracking habitability issues around red dwarfs, but this new habitability model offers a close look at what can go wrong and suggests that the flare and emission problem may be more dangerous than we have previously estimated. High flare activity can cause atmospheric molecules to fragment into atoms, while continuing bombardment can ionize atmospheric gases, separating electrons that can be lost to space.
Ion escape is the process of positively charged ions being drawn out of the atmosphere. The Airapetian model looks at oxygen ion escape, which can be tracked even on Earth, although on a much smaller scale. Superflares of the kind found on young red dwarfs, the model finds, can cause loss of atmospheric oxygen, hydrogen and nitrogen. And losing hydrogen and oxygen from the atmosphere could eliminate a young planet’s water supply.

Image: In this artist’s concept, X-ray and extreme ultraviolet light from a young red dwarf star cause ions to escape from an exoplanet’s atmosphere. Scientists have developed a model that estimates the oxygen ion escape rate on planets around red dwarfs, which plays an important role in determining an exoplanet’s habitability. Credit: NASA Goddard/Conceptual Image Lab, Michael Lentz, animator/Genna Duberstein, producer.
The paper proposes, then, that we extend our idea of a habitable zone in the case of stars that show X-ray and extreme ultraviolet radiation levels 7 to 10 times the average emissions from our Sun, at which point the effects of space weather come into play. A planet like Proxima b, orbiting 20 times closer to its star than the Earth is to the Sun, clearly falls within the space weather range, and the authors estimate oxygen loss would occur in its atmosphere within 10 million years.
Add to this the effects of the star’s stellar wind and the conclusion is stark: Proxima b is most likely not a habitable world. “We have pessimistic results for planets around young red dwarfs in this study,” says Airapetian, “but we also have a better understanding of which stars have good prospects for habitability.” Could life emerge at a later date in red dwarfs whose stellar activity has slowed over time, and if so, what mechanisms could replenish a planetary atmosphere? There is much to ponder here as we assess red dwarf habitability.
The paper is Airapetian et al., “How Hospitable Are Space Weather Affected Habitable Zones? The Role of Ion Escape,” Astrophysical Journal Letters Vol. 836, No. 1 (abstract). This NASA news release is also useful.
Cassini: Grazing the Rings
I don’t want to get much deeper into February without looking at the recent Cassini imagery from Saturn’s rings. Cassini, after all, is a precious resource, and every day that passes brings us closer to its mission-ending plunge into Saturn’s cloud tops this September. Leading into that climactic event, however, we have the current ring-grazing orbits, a mission segment that is about half completed. Mission’s end gives us the chance to see the rings in exquisite detail.
20 orbits are involved in the ring-grazing phase, each diving past the outer edge of the main ring system, before things get even more dramatic, and the so-called ‘grand finale’ begins. The latter is to include 22 orbits that will take Cassini through the gap between the rings and Saturn itself, with the first plunge scheduled for April 26. The payoff is immense: We’ve never had views as close or as dramatic of small moons like Daphnis, seen in the image below.
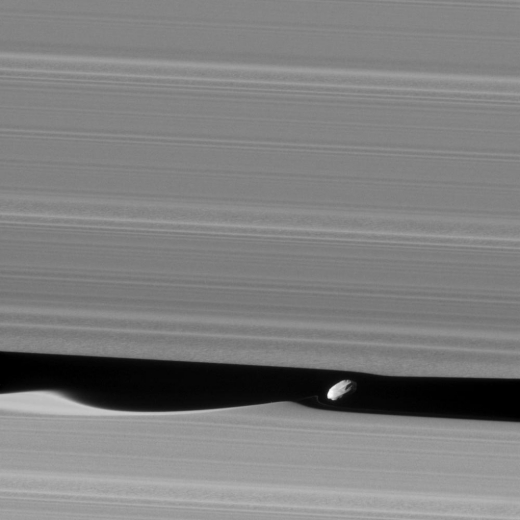
Image: The wavemaker moon, Daphnis, is featured in this view, taken as NASA’s Cassini spacecraft made one of its ring-grazing passes over the outer edges of Saturn’s rings on Jan. 16, 2017. This is the closest view of the small moon obtained yet. Daphnis (8 kilometers across) orbits within the 42-kilometer wide Keeler Gap. Cassini’s viewing angle causes the gap to appear narrower than it actually is, due to foreshortening. The little moon’s gravity raises waves in the edges of the gap in both the horizontal and vertical directions. Credit: NASA/JPL-Caltech/Space Science Institute.
The interactions between moon and ring are particularly interesting here. In several wide lanes in the ring, we seem to be seeing structures where particles have clumped together, marked by their grainy texture. At the left of the moon as seen in the image, the edge of the Keeler Gap appears softened, which scientists speculate is due to the movement of ring particles into the gap after Daphnis’ most recent approach on the orbit before this one.
When Cassini arrived at Saturn back in 2004, we also were able to work with a high level of ring detail, seeing features called ‘straw’ and ‘propellers’ that were the result of ring particles clumping and interactions with embedded, tiny moons. I had to go back and look at my notes on this — Cassini, as noted in this JPL news release, actually closed to an even tighter distance from the rings during the Saturn arrival, but the imagery it sent back was not as good because of the need to use short exposure times to avoid smearing due to the spacecraft’s motion over the ring plane.
The current views are taken in both the backlit and sunlit side of the rings, and we have dozens of passes to work with as the mission nears its terminus. Carolyn Porco (Space Science Institute, Boulder CO) is imaging team lead:
“As the person who planned those initial orbit-insertion ring images — which remained our most detailed views of the rings for the past 13 years — I am taken aback by how vastly improved are the details in this new collection. How fitting it is that we should go out with the best views of Saturn’s rings we’ve ever collected.”

Image: This image shows a region in Saturn’s outer B ring. NASA’s Cassini spacecraft viewed this area at a level of detail twice as high as it had ever been observed before. And from this view, it is clear that there are still finer details to uncover. Researchers have yet to determine what generated the rich structure seen in this view, but they hope detailed images like this will help them unravel the mystery. In order to preserve the finest details, this image has not been processed to remove the many small bright blemishes, which are created by cosmic rays and charged particle radiation near the planet. Credit: NASA/JPL-Caltech/Space Science Institute.
The image below, also only lightly processed, was taken in visible light with Cassini’s wide-angle camera on December 18, 2016. Here we’re looking at a distance of approximately 56,000 kilometers, with an image scale of about 340 meters per pixel.

Image: This Cassini image features a density wave in Saturn’s A ring (at left) that lies around 134,500 km from Saturn. Density waves are accumulations of particles at certain distances from the planet. This feature is filled with clumpy perturbations, which researchers informally refer to as “straw.” The wave itself is created by the gravity of the moons Janus and Epimetheus, which share the same orbit around Saturn. Elsewhere, the scene is dominated by “wakes” from a recent pass of the ring moon Pan. Credit: NASA/JPL-Caltech/Space Science Institute.
On a personal note, Cassini was much in my thoughts during its final insertion into Saturn’s orbit, which it entered on July 1, 2004. During the approach to the planet, all I could think about was that we were trying to put a spacecraft through a gap between two of Saturn’s rings — the F and G rings — using a complicated maneuver that involved spacecraft rotation to shield its instrumentation from ring particles followed by a decelerating engine burn.
Actually crossing Saturn’s ring plane to do this seemed like science fiction come to life. At the same time that year, I was working on getting Centauri Dreams up and running, trying to figure out the software and making choices about hosting providers, all the stuff people do when they’re trying to create an online publication. For me, the Cassini arrival and Centauri Dreams will always be inextricably linked.
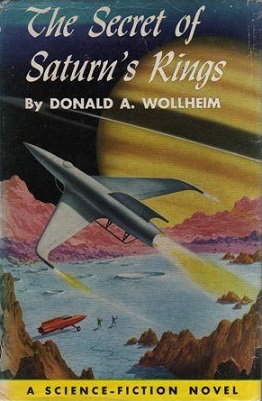
Also linked: Donald Wollheim’s 1954 novel The Secret of Saturn’s Rings, one of the Winston juveniles that many of us absorbed as space-struck kids. I have a suspicion that at least a few of those now working Cassini’s ring passage have a happy memory of this title. I hadn’t recalled the book in decades, but these ring-crossing orbits brought it all back. Nice Alex Schomburg cover!

Follow with RSS or E-Mail
