Having just looked at events that may have shaped Jupiter’s core, it seems a good time to note the new Hubble image of the planet, taken on June 27, 2019. A couple of things to focus on in the image below: The vast anticyclonic storm we call the Great Red Spot, about the diameter of the Earth, is evident as it rolls counterclockwise between bands of clouds moving in opposite directions toward it.
We still don’t know why, but the storm itself continues to shrink. Smaller storms show up vividly as white or brown ovals, some of which dissipate within hours, while others may be as long lasting as the Great Red Spot, which has dominated Jupiter’s face for at least 150 years. Note the cyclone showing up south of the Spot, visible as a worm-shaped feature. You can also see other anticyclones, appearing as white ovals.
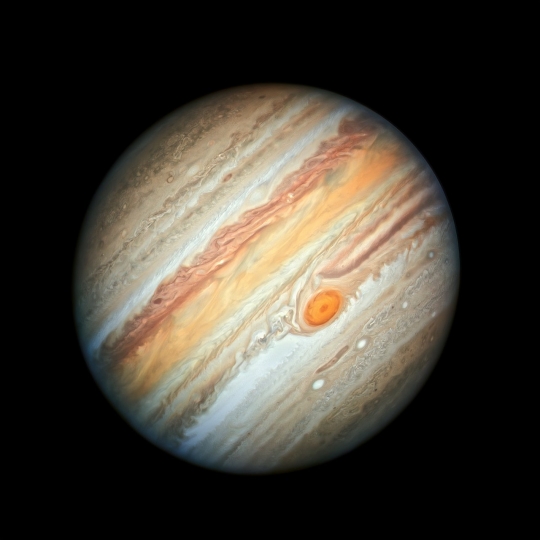
Image: The NASA/ESA Hubble Space Telescope reveals the intricate, detailed beauty of Jupiter’s clouds in this new image taken on 27 June 2019. It features the planet’s trademark Great Red Spot and a more intense colour palette in the clouds swirling in the planet’s turbulent atmosphere than seen in previous years. This image was captured by Hubble’s Wide Field Camera 3, when the planet was 644 million kilometres from Earth. Credit: NASA, ESA, A. Simon (Goddard Space Flight Center), and M.H. Wong (University of California, Berkeley).
But let’s move beyond Hubble. New work on the storm clouds of Jupiter swirling through the planet’s atmospheric belts has just appeared, drawing not only on space-based resources but also a mix of optical and radio telescopes that have gone into recent tracking of their activity. In January of 2017, Australian amateur astronomer Phil Miles observed the bright plume of a storm that was subsequently picked up by observations with the Atacama Large Millimeter/Submillimeter Array (ALMA) in Chile. The latter work was led by UC-Berkeley astronomer Imke de Pater, producing a paper that has been accepted at the Astronomical Journal (citation below).
Things happen quickly enough on Jupiter that we can track them by daily observation, and Hubble images taken a week after the ALMA work showed that what had been a single plume had spawned a second plume and left visible downstream changes in Jupiter’s south equatorial belt. Moreover, four bright spots seen three months earlier in the north equatorial belt had disappeared, while the belt itself had widened as well as changed colors, from a striking white to orange-brown. This may be the result of gas from plumes now depleted of ammonia falling back into the lower atmosphere.
“If these plumes are vigorous and continue to have convective events, they may disturb one of these entire bands over time, though it may take a few months,” says de Pater. “With these observations, we see one plume in progress and the aftereffects of the others.”
The paper posits that plumes like these emerge about 80 kilometers below the cloud tops, in a region where clouds of liquid water droplets are common. Jupiter’s atmosphere is primarily hydrogen and helium, with trace amounts of methane, ammonia, hydrogen sulfide and water. What we’re seeing at the top-most cloud layer, with its brown belts and white zones, is largely made up of ammonia ice. A layer of solid ammonium hydrosulfide particles is found below this in the upper cloud deck.
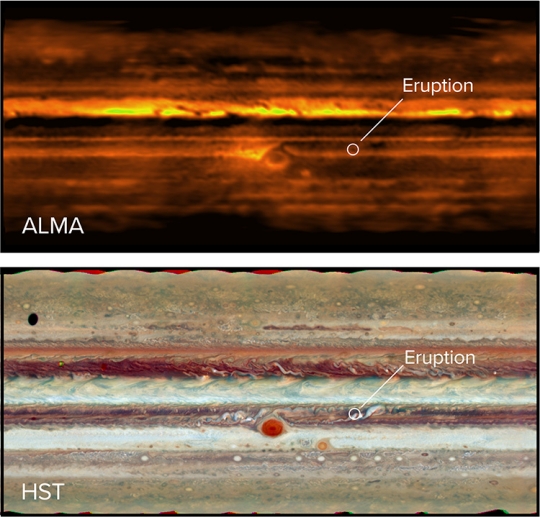
Image: ALMA’s view of Jupiter at radio wavelengths (top) and the Hubble Space Telescope’s view in visible light (bottom). The eruption in the South Equatorial Belt is visible in both images: a dark spot in radio, a bright spot in visible. Credit: ALMA image by Imke de Pater and S. Dagnello; Hubble image courtesy of NASA.
The radio telescopes of ALMA are able to see beneath the upper ammonia clouds that are opaque in visible frequencies, but de Pater’s team also brought data from Hubble, the Very Large Array, the Gemini, Keck and Subaru observatories in Hawaii and the Very Large Telescope (VLT) in Chile into the mix, homing in on the storm seen above as it emerged from the lower cloud levels into the upper ammonia ice clouds.

Image: A closeup of the two bright white plumes (center) in the South Equatorial Belt of Jupiter and a large downstream disturbance to their right. Credit: Imke de Pater, UC Berkeley; Robert Sault, University of Melbourne; Chris Moeckel, UC Berkeley; Michael Wong, UC Berkeley; Leigh Fletcher, University of Leicester.
The storm clouds, reaching Jupiter’s tropopause, where the atmosphere is at its coldest, spread out in much the same way as the anvil-shaped formations of thunderstorms we see in Earth’s atmosphere. The ALMA data were sufficient to show that high concentrations of ammonia gas are forced upward during an eruption like this. Convection, the scientists believe, brings both ammonia and water vapor high enough for the water to condense into liquid droplets, releasing heat along the way.
Now we have a plume with enough momentum that, as heat is released from condensing water, can break out above the clouds of the upper deck, where the ammonia will freeze to create the white plume of these images.
“We were really lucky with these data, because they were taken just a few days after amateur astronomers found a bright plume in the South Equatorial Belt,” adds de Pater. “With ALMA, we observed the whole planet and saw that plume, and since ALMA probes below the cloud layers, we could actually see what was going on below the ammonia clouds.”
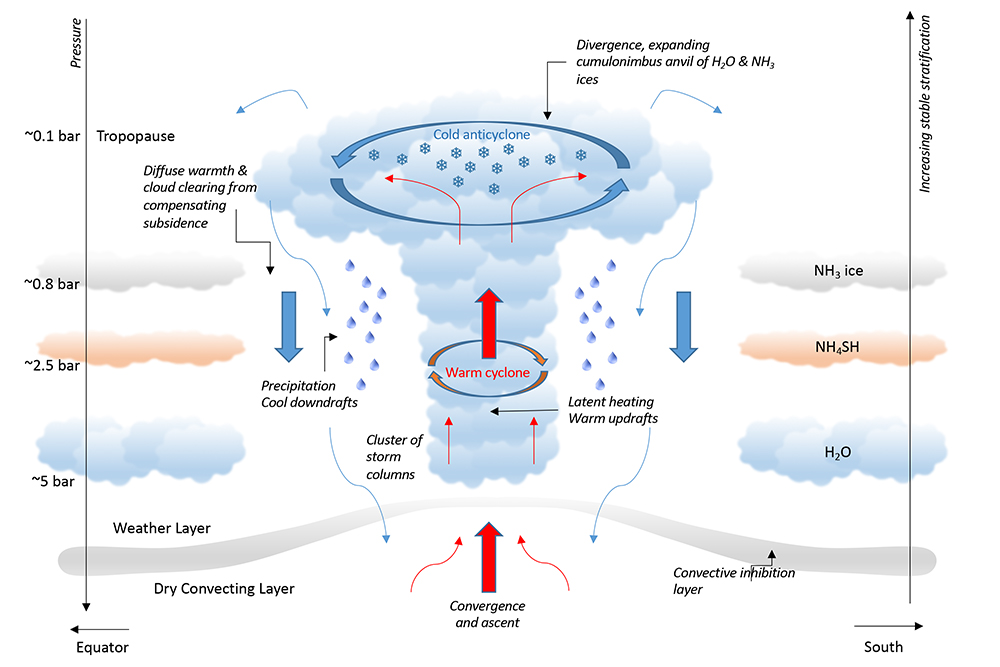
Image (click to enlarge): An illustration of “moist convection” in Jupiter’s atmosphere shows a rising plume originating about 80 kilometers below the cloud tops, where the pressure is five times that on Earth (5 bar), and rising through regions where water condenses, ammonium hydrosulfide forms and ammonia freezes out as ice, just below the coldest spot in the atmosphere, the tropopause. Credit: Adapted from illustration by Leigh Fletcher, University of Leicester.
This useful analysis was made possible because of simultaneous observations at different wavelengths, in this case homing in on transient events and showing us how the atmosphere at different levels, from cloud tops to deep below, responds to them. This is new ground in the study of Jupiter’s weather, as the paper notes:
These data are the first to characterize the atmosphere below the cloud layers during/following such outbreaks. Aided also by observations ranging from uv to mid-infrared wavelengths, we have shown that the eruptions are consistent with models where energetic plumes are triggered via moist convection at the base of the water cloud. The plumes bring up ammonia gas from the deep atmosphere to high altitudes, where NH3 gas is condensing out and the subsequent dry air is descending in neighboring regions. The cloud tops are cold, as shown by mid-infrared data, indicative of an anticyclonic motion, which causes the storm to break up, as expected from similarities to mesoscale convective storms on Earth. The plume particles reach altitudes as high as the tropopause.
The paper is de Pater et al., “First ALMA Millimeter Wavelength Maps of Jupiter, with a Multi-Wavelength Study of Convection” (preprint).


Anyone taking bets for the time of the disappearance of the GRS?
Speaking of storms on giant planets, these 2 papers from the ArXiv about Saturn’s polar vortex remind us that even experts can be fooled into thinking familiar looking features might work similarly on other planets.
https://arxiv.org/pdf/1908.08096
https://arxiv.org/pdf/1908.08092
This also disappoints the storm chaser in me. But that more ‘Earth-cetrism’ I guess.
P
It is amazing that certain radio frequencies, the millimeter and centimeter wavelength can penetrate beneath the cloud tops which are opaque to visible frequencies revealing lower layers and convection.
The model shows ammonium hydrosulphide as one component. This forms a yellow/orange gas. Yet the band color on Jupiter coincident with the highest concentration of ammonia is reddish. This makes me wonder if more exotic chemistry is not going one, perhaps making nitrogenous organic compounds with this color. If there is any carbon in the atmosphere (CH$, CO, CO2) these might well react with ammonia in a Miller-Urey type condition to form amino acids.
I’m not suggesting life, or even prebiotic life, just a lot more interesting prebiotic chemistry than is suggested by the diagram.