Centauri Dreams
Imagining and Planning Interstellar Exploration
Chinese Mission to an Earth Co-Orbital
This morning’s entry resonates with Jim Benford’s recent work on objects that are co-orbital with Earth (see A SETI Search of Earth’s Co-Orbitals). You’ll recall that Benford argues for close study of co-orbitals like Cruithne (3753), a 5-kilometer object with closest approach to Earth of 0.080 AU, and 2010 TK7, which oscillates around the Sun-Earth Lagrangian point L4. A number of other such objects are known in a 1:1 orbital resonance with Earth, but they are seldom studied or even mentioned in the literature.
Calling for SETI observations at radio and optical wavelengths, as well as lighting up the objects with planetary radar, Benford gives a nod to Ronald Bracewell, who speculated that one way for an extraterrestrial intelligence to study a stellar system would be to plant a probe within it that could inform the home civilization about events there. The Earth co-orbitals are made to order for such observation, so why not give them a look with all the tools in our SETI arsenal?
Now we learn that China plans to explore the near-Earth asteroid 2016 HO3, along with a main-belt comet designated 133P. An interesting move — 2016 HO3 is the closest, most stable quasi-satellite of Earth, with a minimum distance of 0.0348 AU. Also known as Kamo?oalewa — a Hawaiian word for an oscillating object in the sky — 2016 HO3 has a minimum orbital intersection distance of 0.0348 AU (5,210,000) km, which is 13.6 times as far away as the Moon, although it seldom comes closer than about 38 lunar distances from us. The Center for Near Earth Object Studies (CNEOS) calculates this one has been in a stable orbit of our planet for about a century and will remain in its orbital pattern for centuries.
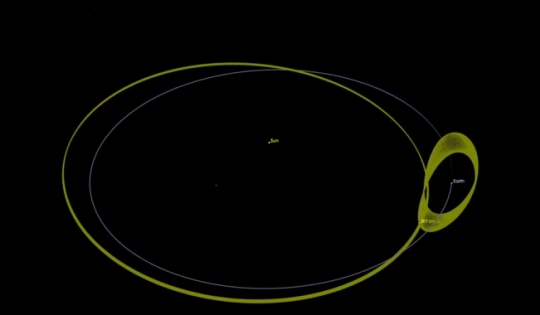
Image: Orbit of 2016 HO3. Credit: James Benford.
According to Liu Jizhong, director of the Lunar Exploration and Space Program Center of the China National Space Administration (CNSA), the current plan is to study 2016 HO3 from space before landing on it to collect samples for return to Earth. Following delivery of the sample return capsule, the probe is to proceed to comet 133P by means of gravity assists at Earth and Mars, in a mission lasting on the order of 10 years.
China is now soliciting proposals for eight types of scientific instruments for the mission among universities, research organizations and private companies both in China and abroad, according to a CNSA news release. Among the instruments needed, Liu says, are a color camera with an intermediate field of view, thermal emission spectrometer, visible and infrared imaging spectrometer, multispectral camera, detection radar, magnetometer, charged and neutral particle analyzer and dust analyzer. Quoting from the news release:
[Liu] said there might be two forms of onboard schemes. One possible scheme is to carry an independent detector on the rocket. After China’s main probe enters the orbit, the onboard detector will separate from the rocket and then perform independent tasks. Its mass should not exceed 200 kg. The other possible option is to let China’s main probe carry the onboard detector to the near-Earth asteroid or the main-belt comet and then release it. The detector could either perform independent scientific exploration or coordinate with the main probe.
If the onboard detector does not separate with the main probe, its mass should not exceed 20 kg. If the detector separates from the main probe near the asteroid, its mass should be no more than 80 kg. If it separates from the main probe near the comet, its mass should not exceed 20 kg.
The deadline for proposals is August 31, 2019, with those interested asked to contact CNSA.
Image: An animation of 2016 HO3’s orbit around Earth 2000-2300. Credit: Phoenix7777 – Own work. Data source: HORIZONS System, JPL, NASA. CC BY-SA 4.0.
This will not be China’s first experience with an asteroid mission. In December of 2012, its second lunar probe, Chang’e-2, made a close approach and flyby of asteroid 4179 Toutatis after completing its primary mission, approaching to within 3.2 kilometers and returning images. Now we have an ambitious mission to give us a close-up look at an Earth co-orbital, with comet operations to follow. We should learn a lot, for right now even the size of 2016 HO3 is not firmly established, though it is believed to be between 40 and 100 meters, depending on assumptions about its albedo, and we do know that it is a fast rotator.

TRAPPIST-1: Of Flux and Tides
Seven planets of roughly Earth-size make TRAPPIST-1 a continuing speculative delight, as witness the colorful art it generates below. And with three of the planets arguably in the star’s habitable zone, this diminutive star attracts the attention of astrobiologists anxious to examine the possible parameters under which they orbit. One thing that is only now receiving attention is the question of planet-to-planet tidal effects, as opposed to the star’s tidal effects on its planets.

Image: An artist’s impression of the perpetual sunrise that might greet visitors on the surface of planet TRAPPIST-1f. If the planet is tidally locked, the “terminator region” dividing the night side and day side of the planet could be a place where life might take hold, even if the day side is bombarded by energetic protons. In this image, TRAPPIST-1e can be seen as a crescent in the upper left of the image, d is the middle crescent, and c is a bright dot next to the star. Credit: NASA/JPL-Caltech.
In our Solar System, we’ve become familiar with the idea that tidal deformation can cause interior heating, a fact that could well support both Europa at Jupiter and Enceladus at Saturn with energy needed to retain temperatures suitable for life below their icy surfaces. The effects are extreme at Io (though hardly life-inducing!) and also noteworthy on Neptune’s large moon Triton. Here again TRAPPIST-1 stands out, because we know of no other system where planets, not moons, are so tightly wound that they can raise significant tides on each other.
Consider TRAPPIST-1g, the sixth planet in the system, which according to a study performed by Hamish Hay and Isamu Matsuyama (Lunar and Planetary Laboratory, University of Arizona) experiences the mixed effects of tidal heating from the central star and the other planets more strongly than any other planet in the system.
Tides from the other planets in a planetary system are rarely seen as a factor, say the scientists, but heating due to tidal deformation is definitely in play here. From the paper:
Such tides are typically negligible because the mass of the central tide raising body is usually far greater than other bodies in the system, and also because the distances between these bodies are vast and the strength of tidal forces decreases with the distance between them cubed. The seven planet extrasolar system TRAPPIST-1…is the first system to be discovered where this is not the case. The separation distance at conjunction is small enough that tides raised by neighbouring planets can become significant, and heating must occur as a result.
Similarly, TRAPPIST-1’s two inner planets come close enough to raise powerful tides on each other, possibly sustaining volcanic activity on worlds that would be too hot on the day side to support life. An atmosphere maintained by volcanic eruptions could move heat to the night side, assuming tidal lock.
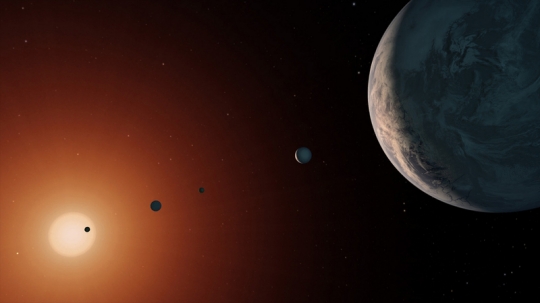
Image: An artist’s concept for a view of the TRAPPIST-1 system from near TRAPPIST-1f. The system is located in the constellation Aquarius and is just under 40 light-years away from Earth. Credit: NASA/JPL-Caltech.
The Trouble with TRAPPIST-1e
We’ve also recently looked at Lisa Kaltenegger’s work on the effect of intense radiation on M-dwarf planets (see M-Dwarfs: Weighing UV Radiation and Habitability). Kaltenegger (Cornell University/Carl Sagan Institute) has been investigating possible ways for life to survive the intense flares and ultraviolet radiation that pummel such worlds. Various mechanisms suggest themselves, enough to keep open the possibility that planets like these could sustain life.
What Federico Fraschetti (Harvard Smithsonian Center for Astrophysics) and colleagues have been studying is the ability of a star so much cooler and less massive than the Sun to emit such quantities of radiation. The scientists have simulated the path of high-energy protons through the magnetic field of the star, finding that the first of the three TRAPPIST-1 planets thought to be in the habitable zone (TRAPPIST-1e) is receiving up to 1 million times more flux than Earth.
We’re fortunate, of course, in being protected by our planet’s magnetic field from our star’s energetic proton bath, but Fraschetti’s calculations show that to have the same effect at TRAPPIST-1e, the planet’s magnetic field would need to be hundreds of times more powerful than Earth’s. The conclusion is based on the star’s most likely field alignment, which brings its energetic protons directly to the surface of TRAPPIST-1e, where damaging biological effects could occur. But much depends upon how the star’s magnetic field is angled away from its axis of rotation, making this a key datapoint for future investigations. From the paper:
Based on the scaling relation between far-UV emission and energetic protons for solar flares by Youngblood et al. (2017), we estimate that the innermost putative habitable planet, TRAPPIST-1e, is bombarded by a proton flux up to 6 orders of magnitude larger than experienced by the present-day Earth. Such a bombardment of planets in this study is found to result largely from the misalignment of the B-field/rotation axis assumed for the star-proxy. Since the exact magnetic morphology and alignment of the magnetic field is currently unknown for TRAPPIST-1, and for M dwarfs in general, our results indicate that determination of these quantities for exoplanet hosts would be of considerable value for understanding their radiation environments.
TRAPPIST-1e, then, may need some of Lisa Kaltenegger’s proposed solutions to the radiation flux problem if it is to be considered habitable. Lithophilic life, or perhaps life beneath an ocean, is one solution among those that Kaltenegger has proposed, and of course there is the possibility of tidal lock, which could keep the ‘dark’ side of the planet free of the flux. Habitability, as we continue to learn, is by no means an easy call, no matter where a planet is located within or without the putative habitable zone of its host.
The papers are Fraschetti et al., “Stellar Energetic Particles in the Magnetically Turbulent Habitable Zones of TRAPPIST-1-like Planetary Systems,” Astrophysical Journal Vol. 874, No. 1 (18 March 2019) (abstract / preprint); and Hay & Matsuyama, “Tides Between the TRAPPIST-1 Planets,” Astrophysical Journal Vol. 875, No. 1 (9 April 2019) (abstract / preprint).
Detection of an Interstellar Meteor
Do we have a second interstellar visitor, following on the heels of the controversial ‘Oumuamua? If so, the new object is of a much different nature, as was its detection. In 2014, a meteor north of Manus Island, off the coast of Papua New Guinea produced a powerful blast that, upon analysis, implied a ? 0.45m meter object massing about 500 kg. Events like this, not uncommon in our skies, are cataloged by the Center for Near Earth Object Studies (CNEOS); this one shows up as being detected at 2014-01-08 17:05:34 UTC.
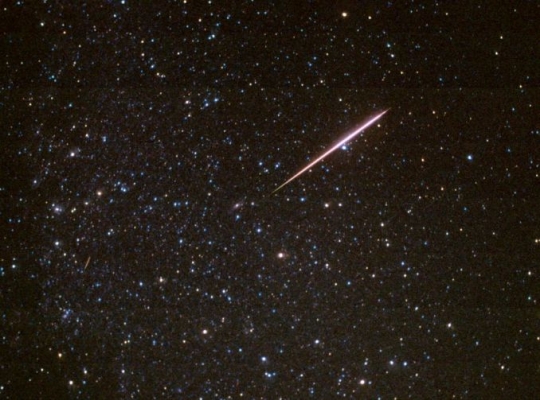
Image: This gorgeous wide-angle photo from the 1997 Perseid shower captures a 20-degree-long fireball meteor and another, fainter meteor trail in a rich area of the northern summer Milky Way. Showers like these are predictable, but could some solitary fireballs mark the end of a meteor with an interstellar origin? Credit & Copyright: Rick Scott & Joe Orman.
Now the CNEOS catalog, which covers the last three decades, is useful indeed, for it takes advantage of detectors maintained by the U.S. government to analyze the sound and light of the passage of objects through the atmosphere, producing information on velocity and position at the time of impact. Harvard’s Avi Loeb, a familiar face in the media thanks to the ‘Oumuamua discussion, worked with undergraduate student Amir Siraj, whom he set to calculating. What could we learn about the prior trajectory of meteors in the catalog, homing in on the fastest?
In a paper submitted to Astrophysical Journal Letters, Loeb and Siraj note the latter’s identification of the 2014 Manus Island meteor as interstellar in origin. The paper finds no substantial gravitational interactions between the meteor and any planet other than Earth. Indeed, based on the CNEOS-reported impact speed of 44.8 km s-1, Loeb and Siraj calculate a speed of 43.8 km s-1 outside the Solar System. For the object to be bound, the observed speed at impact would have to be off by more than 45%.
This meteor, then, was on an unbound hyperbolic orbit. We can go on from here to note the object’s relation to another useful metric. For measured relative to the Local Standard of Rest, this meteor entered the Solar System with a speed of 60 kilometers per second.
The Local Standard of Rest (LSR) is produced by averaging the motion of all stars in the Sun’s neighborhood. Siraj and Loeb speculate that this velocity could indicate ejection from a planetary system, specifically from the inner regions where orbital speeds are high. The object’s speed would imply a position inside the orbit of Mercury were it to come from a star like our own, but a red dwarf like Proxima Centauri would have an ejection speed from its habitable zone in this very regime. Recall that the habitable zone around Proxima Centauri is 20 times closer to the star than the HZ in our own system. So here’s an interesting thought: “Since dwarf stars are most common, the detection of this meteor offers new prospects for ‘interstellar panspermia,’ namely the transfer of life between planets that reside in the habitable zones of different stars.”
What I’m quoting from above is an as yet unpublished summation Loeb has recently written of the paper’s findings, one that goes on to speculate about its implications. Panspermia would require a larger object because it would have to survive the fiery passage through the atmosphere, but the notion that objects could be passed from star to star in this way is interesting (and note that Loeb is not identifying a Proxima Centauri origin for this meteor, but rather pointing to possible scenarios between stars). The point is that dwarf stars are the most common in the universe, and the detection of an interstellar meteor could point to what is perhaps a common form of transfer between stars.
Beyond that, consider the possibilities in studying interstellar materials when we may find them entering our own atmosphere. Says Loeb:
Using the Earth’s atmosphere as a detector for interstellar objects offers new prospects for inferring the composition of the gases they leave behind as they burn up in the atmosphere. In the future, Astronomers may establish an alert system that triggers follow-up spectroscopic observations to an impact by a meteor of possible interstellar origin. Alert systems already exist for gravitational wave sources, gamma-ray bursts, or fast radio bursts at the edge of the Universe. Even though interstellar meteors reflect the very local Universe, they constitute a “message in a bottle” with fascinating new information about nurseries which may be very different from the Solar System. Some of them might even represent defunct technological equipment from alien civilizations, which drifted towards Earth by chance, just like a plastic bottle swept ashore on the background of natural seashells.
Thus spectroscopy of gaseous debris burning up in the Earth’s atmosphere could offer us a way to make interstellar investigations of the kind we’ve been assuming would be decades (at least) off, assuming we can make a timely identification of likely targets.
The paper is Siraj & Loeb, “Discovery of a Meteor of Interstellar Origin,” submitted to Astrophysical Journal Letters (preprint).
Going Interstellar in Europe
Foundations of Interstellar Studies Workshop in UK
A workshop on interstellar flight titled Foundations of Interstellar Studies is to take place from 27 to 30 June of this year in the town of Charfield, Gloucestershire, United Kingdom, at the current headquarters of the Initiative for Interstellar Studies. This follows an initial ‘foundations’ conference in 2017 that was held at City College New York and the Harvard Club of New York; future conferences, “run jointly between several organisations depending on the host country,” are planned on a roughly two-year schedule. I immediately warmed to the theme that the Initiative for Interstellar Studies (i4IS) introduced by quoting Robert H. Goddard:
How many more years I shall be able to work on the problem I do not know; I hope, as long as I live. There can be no thought of finishing, for ‘aiming at the stars’ both literally and figuratively, is a problem to occupy generations, so that no matter how much progress one makes, there is always the thrill of just beginning.

Browsing through the conference materials I note that, with reference to famous physics conferences like Shelter Island, Pocono and Oldstone, the emphasis is on both academic rigor but also informal conversation, a format that i4IS president Kelvin Long hopes will energize the interstellar community. The aim is “to get researchers together and to maximize the social interaction time for idea swapping and information exchange and it is expected that the ideas and discussions (and maybe even calculations) should continue into the evening social sessions.”
The three days of discussions in this year’s conference will take place at the Bone Mill, which has been the i4IS headquarters since 2017. This is beautiful country, as those of you who have been to the Cotswolds will already know, in the village of Charfield, near Wootton-under-Edge, in the English county of Gloucestershire. The three themes under focus, each with a day devoted to it:
- Living in Deep Space
- Advanced Propulsion Technology & Missions
- Building Architectural Megastructures
In addition to the formal scientific proceedings, there will be an opening social event on the evening of Thursday 27th June, starting at 18:00 hours at the Bone Mill. There will also be a formal dinner on Saturday 29th June starting at 19:00 hours at a venue to be announced.
An invitation will be made to submit papers from selected authors post-conference, to the Journal of the British Interplanetary Society (JBIS) and/or publication in the official conference proceedings. For more on the Foundations of Interstellar Studies Workshop 2019, including maps and information on accommodation, go to https://www.fisw.space/fisw-2019.
Horizon 2061 Synthesis Workshop in Toulouse
2061 will commemorate an interesting year in space exploration. It is the centennial not just of the first human flight into space by Yuri Gagarin but also of the speech by which John Kennedy propelled the US aerospace community into a determined drive for a lunar landing. But we might also add another memorable factor. In 2061, Comet Halley makes its return. The last time we saw Halley was in 1986, when five spacecraft ranging in origin from the European Space Agency to the Soviet Union and France as well as Japan studied the comet in the inner system.
Thus we had the first comet observed in detail by spacecraft, giving us information about the cometary nucleus, the coma and the tail, helping us understand cometary structure. The fact that the Halley expeditions were so determinedly multinational (although the studied US solar sail never materialized) gives impetus to an effort called Planetary Exploration Horizon 2061 which, according to its founders is creating a long-term analysis of four primary areas of space exploration, all of these addressed from a determinedly international perspective.
From the Horizon 2061 website:
By 2061, all the “frontiers” (or outer boundaries) of exploration should have moved dramatically outwards: human exploration might have reached Mars and perhaps the main asteroid belt; sample return missions should have reached, beyond the asteroid belt, the Trojan asteroids on the orbit of Jupiter and the icy moons of Jupiter and Saturn; robotic exploration should have reached the very local interstellar medium, well beyond the outer shock of the heliosphere, thus opening the way towards the closest stars and their planetary systems.

Thus the “the four pillars of planetary exploration” Horizon 2061 is examining:
- Major scientific questions on planetary systems;
- Representative space missions that answering these questions will demand;
- Enabling technologies needed to make these missions happen;
- Ground- and space-based infrastructure needed for mission support.
The overall goal:
[The year 2061] symbolically represents our intention to encompass both robotic and human exploration in the same perspective. Its distant horizon, located well beyond the usual horizons of the planning exercises of space agencies and of their standing committees, which generally address shorter time scales, avoids any possible confusion with them and is intended to trigger a joint foresight thinking of the scientific and technology communities of planetary exploration that will free the imagination of the planetary scientists, who are invited to formulate what they think are the most relevant and important scientific questions independently of the a priori technical feasibility of answering them; of the engineers and technology experts, who are invited to explore innovative technical solutions that will make it possible to fly by 2061 the challenging space missions that will allow us to address these questions.
Space missions are designed, the Horizon 2061 proponents note, around a Science Traceability Matrix (STM) in which mission science questions and objectives define the instruments needed, the mission profile and the kind of platform on which the mission will be flown. Unlike single missions, though, Horizon 2061 intends to write the STMs for a set of representative missions that will investigate everything from the origin of planetary systems to the detection of life. Observations to be made and destinations within the Solar System where such measurements can be performed will determine the type of space missions that emerge from this matrix.
Two meetings have already occurred, the first in Bern in September of 2016, the second in Lausanne in April of 2018. Coming now is the next step, devoted to the synthesis of the exercise. This will take place in an international colloquium hosted by the Université Paul Sabatier in Toulouse from June 5th to 7th, 2019.
The primary organizers will be the Institut de Recherche en Astrophysique et Planétologie (IRAP) and the Observatoire Midi-Pyrénées (OMP). This colloquium, placed under the sponsorship of COSPAR [Committee on Space Research, established by the International Council for Science in 1958], will complete the design of the four pillars and initiate the drafting of the final report, which will be edited and published under the auspices of COSPAR.
Tentative conclusions from the colloquium will be presented for discussion at the joint EPSC-DPS meeting (European Planetary Science Conference – AAS Division for Planetary Sciences) in Geneva (September 15th to 20th, 2019), and later for discussion and final approval at the COSPAR General Assembly (Sydney, August 15th to 23rd, 2020).
Meeting agenda, registration and other materials are available at https://h2061-tlse.sciencesconf.org/.
Proxima Centauri c?
A possible second planet around Proxima Centauri raises all kind of questions. I wasn’t able to make it to Breakthrough Discuss this year, but I’ve gone over the presentation made by Mario Damasso of Turin Observatory and Fabio Del Sordo of the University of Crete, recounting their excellent radial velocity analysis of the star. Proxima c is a fascinating world, if it’s there, because it would be a super-Earth in a distant (and cold) 1.5 AU orbit of a dim red star. Exactly how it formed and whether it migrated to its current position could occupy us for a long time.
But is it there? The first difficulty has to do with stellar activity, which Damasso and Del Sordo were careful to screen out; it’s one of the major problem areas for radial velocity work in this kind of environment, for red dwarf stars are often quite active. During the question and answer session, another key question emerged: We know from Kepler that many stars are orbited by multiple planets, and there is no reason to assume that Proxima Centauri has but one.
The question: If there are other, smaller worlds in play here, could the effect of their combined masses produce a ‘phantom’ Proxima c in the orbit Damasso and Del Sordo have discussed?
The two astronomers are completely open to this possibility, and point to the need for follow-up observations with ESPRESSO, not to mention the useful Gaia measurements that could give us even more detail. Flare activity is always an issue in any case — it may have affected the results of Anglada et al. in 2018 (citation below), when researchers found possibly two inner dust belts and one outer belt around the star (see Proxima Centauri Dust Indicates a Complicated System). The Damasso and Del Sordo work is comprehensive as far as it can go, but both were careful to note that we are dealing solely with a candidate, not a confirmed world. And it could well be the result of other, unseen planets affecting the star as well as stellar noise.
This work draws on the earlier Proxima Centauri radial velocity dataset compiled by Guillem Anglada-Escudé (University of London) and team, but folds in an additional 61 RV observations, with considerable attention to the question of filtering out the 85 day rotation period of the parent star and the associated noise of stellar surface perturbations. The instrument in play is the European Southern Observatory’s High Accuracy Radial Velocity Planet Searcher (HARPS) spectrograph at La Silla.
I suspect we’re going to find a number of small worlds around Proxima Centauri, so we’ll see how their gravitational interactions might affect the spectroscopic data and hence the confirmation of the current candidate. But if this detection is confirmed, this is what we’ve found: The planet would mass about six Earths — remember that because this is radial velocity, we can only measure a minimum mass, because we don’t know planetary inclination — and would orbit Proxima Centauri with a period of 1900 days at 1.5 AU. Not exactly a habitable place for the likes of our species. Del Sordo estimates temperatures there would be about 40 K.
We may know, via Gaia, whether Proxima Centauri c is an actual world by the end of this year. A key follow up question is, can we snag a direct image in visible light? If so, it would mark the first such detection of a planet outside our Solar System, the imaged worlds found thus far having been discovered via infrared. There is plenty, in other words, to like about the hypothetical Proxima Centauri c, provided it’s really there. Waiting a few more months could give us a firm answer.
On another matter, as a great admirer of Thoreau, I was pleased that Damasso and Del Sordo quoted him at the beginning of their presentation, and to good effect: “If you have built castles in the air, your work need not be lost; that is where they should be. Now put the foundations under them.” That’s a good metaphor for RV studies as exceedingly delicate as these. I’ll add a favorite bit from one of Thoreau’s poems:
For lore that’s deep must deeply studied be,
As from deep wells men read star-poetry…
There’s poetry indeed in the spectroscopic data of our nearest star, if we can just tease out its meaning. And here’s an image that might evoke a bit of poetry to close today’s entry.
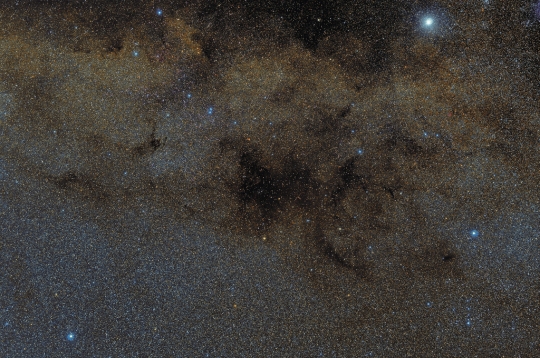
Image: Rigil Kentaurus is the bright star near the top of this broad southern skyscape. Of course it’s probably better known as Alpha Centauri, nearest star system to the Sun. Below it sprawls a dark nebula complex. The obscuring interstellar dust clouds include Sandqvist catalog clouds 169 and 172 in silhouette against the rich starfields along the southern Milky Way. Rigil Kent is a mere 4.37 light-years away, but the dusty dark nebulae lie at the edge of the starforming Circinus-West molecular cloud about 2,500 light-years distant. The wide-field of view spans over 12 degrees (24 full moons) across southern skies. Credit & Copyright: Roberto Colombari.
The paper on dust belts around Proxima Centauri is from Guillem Anglada, “ALMA Discovery of Dust Belts Around Proxima Centauri,” Astrophysical Journal Letters Vol. 850 No. 1 (15 November 2017) (abstract). (Note: This is not Guillem Anglada-Escudé, despite the similarity in names!) The Damasso and Del Sordo paper is as yet unpublished, though undergoing peer review. Video of their presentation is available at https://www.youtube.com/watch?v=DLzzg9p0-AI&t=15648s (go to about 4:16:45 on the video).
Reflections on Messier 87’s Black Hole
Messier 87, a massive elliptical galaxy in the Virgo cluster, is some 55 million light years from Earth, and even though the black hole at its center has a mass 6.5 billion times that of the Sun, it’s a relatively small object, about the size of our Solar System. Resolving an image of that black hole is, says the University of Arizona’s Dimitrios Psaltis, like “taking a picture of a doughnut placed on the surface of the moon.” But the M87 black hole is one of the largest we could see from Earth, making it a natural target for observations, in this case using radio telescopes working at a frequency of 230 GHz, corresponding to a wavelength of 1.3mm.
A decade ago, working with Avery Broderick, Harvard’s Avi Loeb highlighted the advantages of M87 as an observational target, finding it in many ways preferable to the black hole at the heart of our own Milky Way:
M87 provides a promising second target for the emerging millimeter and submillimeter VLBI capability. Its presence in the Northern sky simplifies its observation and results in better baseline coverage than available for Sgr A*. In addition, its large black hole mass, and correspondingly long dynamical timescale, makes possible the use of Earth aperture synthesis, even during periods of substantial variability.
That paper, “Imaging the Black Hole Silhouette of M87: Implications for Jet Formation and Black Hole Spin,” is worth revisiting (abstract), for those intrigued with how these observations get made and the kinds of things we can learn from them.
I was reminded, when I first saw the now famous image, of the nature of M87 itself. Elliptical galaxies, unlike our barred spiral Milky Way, show slow rates of star formation, their primary population being older stars, and as you would imagine, they contain little gas and dust, while also housing a large number of globular clusters. Back in 2012, I ran across a paper by Falguni Suthar and Christopher McKay (NASA Ames) assessing habitability in such galaxies. What an environment to set a science fiction story! Consider the image below before we cut to the black hole image that is now center stage in the news, because here’s the context:
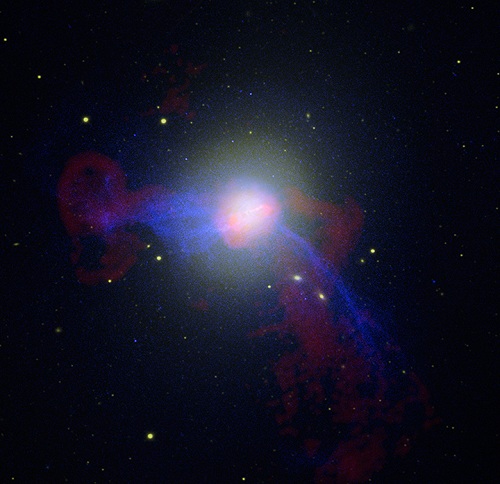
Image: A composite of visible (or optical), radio, and X-ray data of the giant elliptical galaxy, M87. M87 lies at a distance of 55 million light years and is the largest galaxy in the Virgo cluster of galaxies. Bright jets moving at close to the speed of light are seen at all wavelengths coming from the massive black hole at the center of the galaxy. It has also been identified with the strong radio source, Virgo A, and is a powerful source of X-rays as it resides near the center of a hot, X-ray emitting cloud that extends over much of the Virgo cluster. The extended radio emission consists of plumes of fast-moving gas from the jets rising into the X-ray emitting cluster medium. Credit: X-ray: NASA/CXC/CfA/W. Forman et al.; Radio: NRAO/AUI/NSF/W. Cotton; Optical: NASA/ESA/Hubble Heritage Team (STScI/AURA), and R. Gendler.
Could life survive in environments like this? I bring this up again as background, but also because yesterday we looked at the question of hardy microorganisms and their ability to withstand high levels of X-ray and UV radiation. Here’s what McKay and Suthar said in 2012:
Complex life forms are sensitive to ionizing radiation and changes in atmospheric chemistry that might result. However, microbial life forms, e.g. Deinococcus radiodurans, can withstand high doses of radiation and are more ?exible in terms of atmospheric composition. Furthermore, microbial life in subsurface environments would be effectively shielded from space radiation. Thus, while a high level of radiation from nearby supernovae may be inimical to complex life, it would not extinguish microbial life.
It’s fascinating to me that we’ve begun studying such questions on a galactic scale. Fascinating too that we’re now peering into the heart of an active galaxy to reveal its powerhouse black hole. By now the image is familiar, but let’s see it again because it’s just extraordinary.
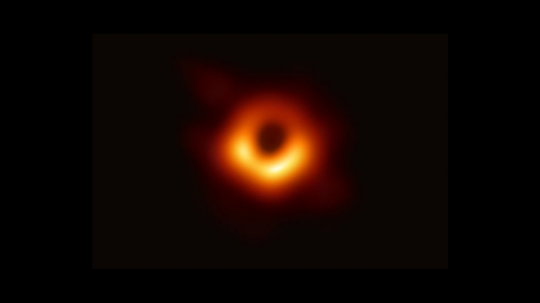
Image: Scientists have obtained the first image of a black hole, using Event Horizon Telescope observations of the center of the galaxy M87. The image shows a bright ring formed as light bends in the intense gravity around a black hole that is 6.5 billion times more massive than the Sun. Credit: Event Horizon Telescope Collaboration.
One thing I saw little attention given to in the coverage was that the Event Horizon Telescope, which produced the image, was supplemented by work from spacecraft. Remember that the EHT is comprised of telescopes located around the surface of our planet, to produce a planet-scale interferometer capable of making such an observation. But the Chandra X-ray spacecraft was also involved, as was the Nuclear Spectroscopic Telescope Array (NuSTAR), and the Neil Gehrels Swift Observatory. All of these, working at X-ray wavelengths, observed the M87 black hole at the same time it was under study by the EHT in April of 2017.
I point to this because while the space assets could not image the black hole, data from them were used to measure the brightness of the M87 jet, particles driven by an enormous energy boost from the black hole itself and surging away from it at nearly the speed of light. The hope here is that X-rays can help us measure particle events near the event horizon to coordinate with the black hole images. Also involved in space was the Neutron star Interior Composition Explorer (NICER), a NASA experiment on the International Space Station that looked at the center of the Milky Way and the black hole known as Sgr A*. Part of the EHT’s mandate is to study the origin of jets like this one, so these extraordinary interactions now become visible.
As to the ground-based observatories of the EHT themselves, what an accomplishment! The international team involved totalled over 200 astronomers, whose work is presented in a special issue of Astrophysical Journal Letters. In the black hole work, the EHT used an array of eight radio telescopes with worldwide coverage, from the Antarctic to Spain, Chile and Hawaii, all located in high-altitude settings where conditions are ideal for observation.
Jonathan Weintroub (CfA) coordinates the EHT’s Instrument Development Group:
“The resolution of the EHT depends on the separation between the telescopes, termed the baseline, as well as the short millimeter radio wavelengths observed. The finest resolution in the EHT comes from the longest baseline, which for M87 stretches from Hawai’i to Spain. To optimize the long baseline sensitivity, making detections possible, we developed a specialized system which adds together the signals from all available SMA dishes on Maunakea. In this mode, the SMA acts as a single EHT station.”
Spectacular. The very long baseline interferometry creates a virtual dish that is planet-sized, able to resolve an object to 20 micro-arcseconds. Working with a conjunction of four nights that would produce clear seeing for all eight observatories, the telescopes took in massive amounts of data — 5,000 trillion bytes of data in all — saved on 1,000 storage disks. Transmitting all that information for subsequent processing was ruled out, for air transport from FedEx could take the hard disks onto which the data had been recorded to a single location much faster. These are signals that needed to be aligned within trillionths of a second to achieve a valid result.
The resulting imagery is the payoff. The central dark region is surrounded by a ring of light, as Einstein’s equations led scientists to expect. We can’t, of course, see the black hole itself, but plasma emitted from its accretion disk, where matter piles up as material falls into the black hole, is heated to billions of degrees and accelerated almost to lightspeed. We get an image of the black hole’s shadow’ that is about 2.5 times larger than the event horizon. M87’s event horizon is thought to be some 25 billion miles across, making it 3 times the size of Pluto’s orbit.
“Once we were sure we had imaged the shadow, we could compare our observations to extensive computer models that include the physics of warped space, superheated matter and strong magnetic fields. Many of the features of the observed image match our theoretical understanding surprisingly well,“ said Luciano Rezzolla, professor for theoretical astrophysics at Goethe University and a researcher on the EHT. “This makes us confident about the interpretation of our observations, including our estimation of the black hole’s mass.“
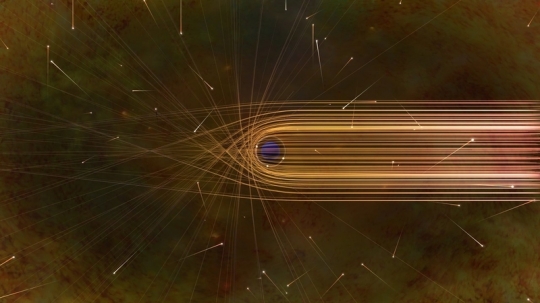
Image: This artist’s impression depicts the paths of photons in the vicinity of a black hole. The gravitational bending and capture of light by the event horizon is the cause of the shadow captured by the Event Horizon Telescope. Credit: Nicolle R. Fuller/NSF.
This is a black hole massive enough that a planet orbiting it could move around it within a week while traveling, says MIT’s Geoffrey Crew, close to the speed of light. Crew’s colleague Vincent Fish, also at MIT’s Haystack Observatory, amplifies on the point:
“People tend to view the sky as something static, that things don’t change in the heavens, or if they do, it’s on timescales that are longer than a human lifetime. But what we find for M87 is, at the very fine detail we have, objects change on the timescale of days. In the future, we can perhaps produce movies of these sources. Today we’re seeing the starting frames.”
Now that’s something worth waiting for, movies of the accretion disk caught in the tortured spacetime of a galaxy’s central black hole. M87 anchors a jet stretching tens of thousands of light years, so we’re talking about seeing the dynamics of the jet’s interactions with the black hole. Fine-tuning EHT methods and expanding its sites points in the direction of further breakthrough imagery.
But what an accomplishment we’ve already achieved via instruments all over the world — ALMA and APEX in Chile, the IRAM 30 meter telescope in Spain, the James Clerk Maxwell telescope and the Submillimeter Array (both in Hawaii), the Large Millimeter Telescope (LMT) in Mexico, the Submillimeter Telescope (SMT) in Arizona and the South Pole Telescope (SPT) in Antarctica.
The papers are The Event Horizon Telescope Collaboration et al., “First M87 Event Horizon Telescope Results. I. The Shadow of the Supermassive Black Hole,” Astrophysical Journal Letters Vol. 875, No. 1 (10 April 2019) (abstract); and from the same issue: “First M87 Event Horizon Telescope Results. II. Array and Instrumentation” (abstract); “First M87 Event Horizon Telescope Results. III. Data Processing and Calibration” (abstract); “First M87 Event Horizon Telescope Results. IV. Imaging the Central Supermassive Black Hole” (abstract); “First M87 Event Horizon Telescope Results. V. Physical Origin of the Asymmetric Ring” (abstract); and “First M87 Event Horizon Telescope Results. VI. The Shadow and Mass of the Central Black Hole” (abstract). The paper on M87 and galactic habitability is Suthar & McKay, “The Galactic Habitable Zone in Elliptical Galaxies,” International Journal of Astrobiology, published online 16 February 2012 (abstract).

Follow with RSS or E-Mail
