Centauri Dreams
Imagining and Planning Interstellar Exploration
Reviving Deep Sky Images from the Past
These days we take in data at such a clip that a mission like New Horizons will generate papers for decades. The same holds true for our burgeoning databanks of astronomical objects observed from the ground. So it only makes sense that we begin to recover older datasets, in this case the abundant imagery — photographs, radio maps, telescopic observations — collected in the pre-digital archives of scientific journals. The citizen science project goes by the name Astronomy Rewind, and it’s actively resurrecting older images for comparison with new data.
Launched in 2017, Astronomy Rewind originally classified scans in three categories: 1) single images with coordinate axes; 2) multiple images with such axes; and 3) single or multiple images without such axes. On October 9, the next phase of the project launched, in which visitors to the site can use available coordinate axes or other arrows, captions and rulers to work out the precise location of each image on the sky and fix its angular scale and orientation.
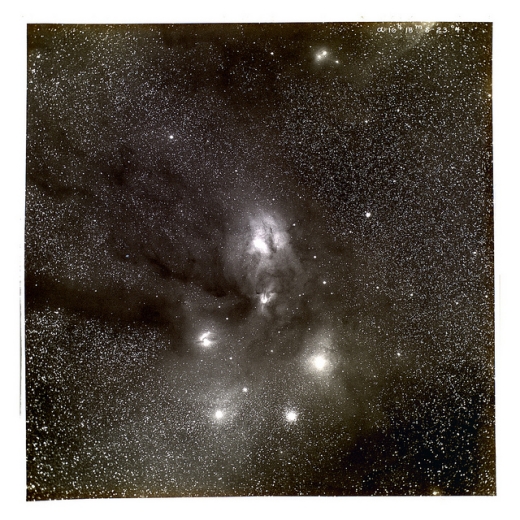
Image: Astronomer E. E. Barnard photographed the Rho Ophiuchi nebula near the border of Scorpius in 1905 through a 10-inch refractor. When he published the image in the Astrophysical Journal five years later, he discussed the possibility — then fiercely debated — that bright nebulae are partially transparent and dark nebulae are opaque, hiding material farther away. Other researchers argued that dark nebulae are simply regions where stars and gas are absent. Credit: American Astronomical Society, NASA/SAO Astrophysics Data System, and WorldWide Telescope.
We have over a century of images to work with, some 30,000 at present drawn from American Astronomical Society journals the Astronomical Journal (AJ), Astrophysical Journal (ApJ), ApJ Letters, and the ApJ Supplement Series. These images were provided through the Astrophysics Data System (ADS), which draws on NASA funding and provides bibliographical and archival services at the Smithsonian Astrophysical Laboratory (SAO), which is part of the Harvard-Smithsonian Center for Astrophysics.
What’s next for the initial round of imagery is inclusion into the WorldWide Telescope. Originally a Microsoft project, the WWT is now managed by the American Astronomical Society, and serves as what the AAS calls a ‘virtual sky explorer that doubles as a portal to the peer-reviewed literature and to archival images from the world’s major observatories.’ 10,000 images (those with coordinate axes) are to be placed within the WWT within a few months, while volunteers proceed to identify where the remaining 20,000 images belong on the sky.
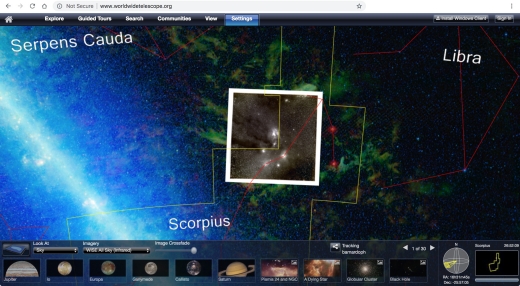
Image: Barnard’s photo has been placed on the sky in its proper position and orientation and is displayed in WorldWide Telescope (WWT) superimposed on a false-color background image from NASA’s Wide-field Infrared Survey Explorer (WISE). Credit: American Astronomical Society, NASA/SAO Astrophysics Data System, and WorldWide Telescope.
But these images are not the only ones arriving for inclusion into the growing database. Results from the related ADS All Sky Survey are also going into the WorldWide Telescope, along with a European image display tool called Aladin, developed at the Centre de Données astronomiques (CDS), Strasbourg Observatory, France. The software highlights the effectiveness of the concept, for with Aladin, users will be able to click on any image that originally appeared in one of the AAS journals and call up the corresponding research paper. Alyssa Goodman, one of the project’s leaders at the Harvard-Smithsonian Center for Astrophysics (CfA), comments:
“Without Astronomy Rewind, astronomers would be unlikely to make the effort to extract an image from an old article, place it on the sky, and find related images at other wavelengths for comparison. Once our revivified pictures are incorporated into WorldWide Telescope, which includes images and catalogs from across the electromagnetic spectrum, contextualization will take only seconds, making it easy to compare observations from a century ago with modern data to see how celestial objects have moved or changed.”
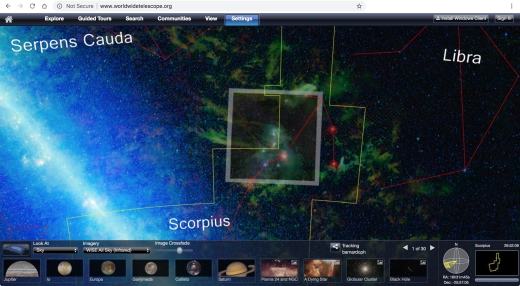
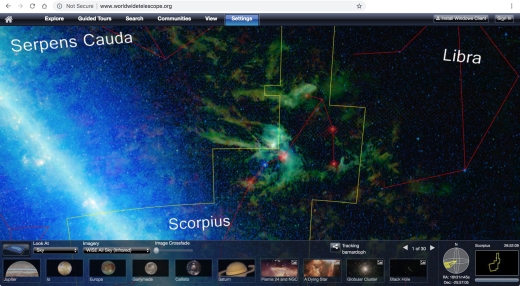
Image: In these two figures, Barnard’s photo has been made partially and fully transparent, respectively, to reveal it in context. In the visible-light photo, gas glows brightly while dust appears in silhouette. In infrared light, as seen by WISE, dust glows brightly where in visible light there was nothing but blackness. Barnard was right! Credit: American Astronomical Society, NASA/SAO Astrophysics Data System, and WorldWide Telescope. Credit: AAS.
As Centauri Dreams readers know, I’ve often enthused about the potential for citizen science projects both in terms of their effectiveness at identifying and cataloging astronomical phenomena as well as the opportunity they present for non-professionals to contribute to fields ranging from deep sky objects to exoplanets and our own Solar System. Astronomy Rewind is clearly keeping the momentum of such efforts going. As it moves into a more challenging phase of confirming the position, scale, and orientation of decades-old astronomical images, the project will offer help features run by astronomy graduate students.
Thus we revive work going back to the 19th Century and link to the work discussing it, with all journal images contextualized on the sky. That’s quite a goal, and it invariably reminds me of the debate over Boyajian’s Star (KIC 8462852, more familiarly known as Tabby’s Star), in which the question of long-term dimming was addressed by a study of 500,000 photographs in the archives of Harvard College Observatory, over a century’s worth of images being digitized through the Digital Access to a Sky Century@Harvard (DASCH) project.
Projects like these are massive in scope and their efforts constitute a heartening work in progress. Ultimately, every astronomical image available in any scientific journal or academic or observatory collection will be catalogued, giving us a way to study the sky over periods of time that are lengthy in comparison to a human lifetime but tiny at the astronomical scale. Nonetheless, KIC 8462852 showed us how an unexpected need to examine old data could propel a scientific debate and flesh out information about a newly discovered mystery.

The Farthest: Voyager in Space
As we continue to track the Voyagers into interstellar space, the spacecraft have become the subject of a new documentary. Associate editor Larry Klaes, a long-time Centauri Dreams essayist and commentator, here looks at The Farthest: Voyager in Space, a compelling film released last year. Larry’s deep knowledge of the Voyager mission helps him spot the occasional omission (why no mention of serious problems on the way to Jupiter, or of the historic Voyager 1 photo of Earth and Moon early in the mission?), but he’s taken with the interviews, the special effects and, more often than not, with the spirit of the production. That spirit sometimes downplays science but does give the Golden Record plenty of air-time, including much that was new to me, such as the origin of the “Send more Chuck Berry!” quip, John Lennon’s role, NASA’s ambivalence, and an odd and insulting choice of venue for a key news conference. Read on for what you’ll see and what you won’t in this film about our longest and most distant mission to date.
By Lawrence Klaes
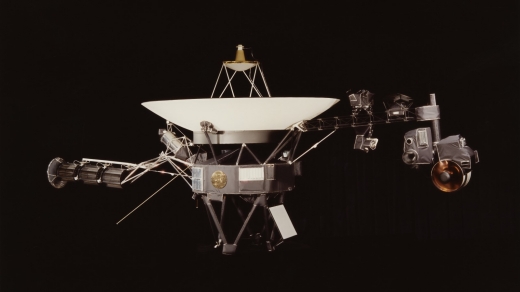
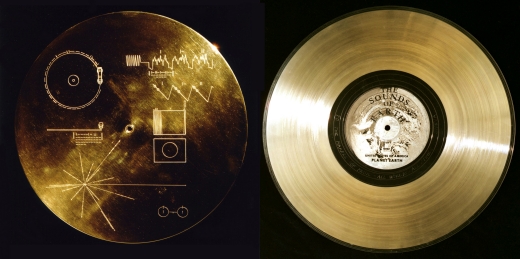
Can one properly represent humanity to the rest of the Milky Way galaxy with just two identical space vessels no bigger than a small school bus and two identical copies of a golden metallic long-playing (LP) record attached to the hulls of said vehicles which contain in their grooves sample images, sounds, languages, and music of their makers and their world?
Our species can only hope so at this point, since the objects in question left Earth over four decades ago and are now tens of billions of miles into deep space heading in different directions through the galaxy. Although primarily planned and built to explore the planets, moons, and rings of the outer Sol system, these vessels were ultimately given another purpose and destiny preordained by their encounters with the places they were sent to. Ironically, this destiny relies on the existence of beings for whom there is as yet no evidence that they are actually out there among the stars.
These records, their carrying vessels and their missions are the focus of the documentary The Farthest: Voyager in Space, which premiered in 2017. Written and directed by Emer Reynolds and produced by John Murray and Clare Stronge for the Irish documentary company Crossing the Line Productions, The Farthest does a masterful artistic job of introducing to generations who were either too young or not yet born to two real space probes on actual missions to alien worlds on a scale never attempted before.
Pioneers and Voyagers, Plaques and Records
The “stars” of The Farthest were originally designated Mariner 11 and 12 by their creators at the National Aeronautics and Space Administration (NASA). They were the descendants of a successful lineage of American deep space probes which had in their ancestry the first visitors to the planets Venus and Mars. However, the space agency wanted to “spice” up their public image and recast these newest members of the Mariner clan as Voyager 1 and 2.
The renaming was appropriate, for these sailors of the interplanetary seas were also descended from what remained of the original Grand Tour plan of the 1960s to examine the outer worlds of the Sol system from Jupiter to Pluto with four nuclear-powered space probes and return unprecedented magnitudes of data about them on a selection of wavelengths.
Launched from Earth in the late summer of 1977, the interplanetary trajectories of the Voyagers past the gas giant worlds would eventually fling them fast enough to permanently escape the gravitational influence of our yellow dwarf star. This would make them only the third and fourth space vessels made by humanity to head towards the interstellar realm after Pioneer 10 and 11, the members of another line of automated American space probes with an impressive exploration pedigree which had celestially paved the way for their more sophisticated brethren just a few years earlier.
The nearly twin Pioneer probes were not only the first spacecraft to visit the planets Jupiter and Saturn between 1973 and 1979, they were also the first to be the recipients of gravitational “slingshots” by those gas giants that sent them towards interstellar space. In case either or both of the probes might one day be found drifting between the stars by sophisticated alien intelligences, each Pioneer carries a small golden plaque attached to their antenna struts. A scientific greeting, the plaques are engraved with basic information on who made these vehicles, what their missions would be, where the probes came from, and when they were lofted into the void.
Recognizing the Voyager missions as two more rare opportunities to preserve and present selected aspects of their species to the wider Milky Way, a small group of professionals from a variety of fields (several of whom were involved with designing the Pioneer Plaques), thinking far ahead, planned and put together a more intricate and detailed “gift package” in the form of a gold-plated copper record. Protected by a thin aluminum cover inscribed with pictogram instructions on how to play it, the Golden Record (as the Voyager Interstellar Record is most often called) contains as much information as could be reasonably etched into the spiraling groove of the 12-inch disc, with over half of the data about the human race being selections of global music.
It has been conservatively estimated that the side of the Golden Records facing outwards (they are bolted to the exteriors of the probes’ main bus) will survive in playable form for at least one billion years in deep space, barring any remote chance of a large cosmic collision or other accident. Hopefully this will be more than enough time for someone to come upon the vessels and their priceless cargo before the galactic environment wears them away to join the rest of its voluminous interstellar dust.
Although the Golden Record was certainly not the main reason for the Voyager missions, they have long since become the prime focus in the public’s mind. After all, the probes’ primary missions ended when Voyager 2 flew through the Neptune system in 1989 and even though they are still functioning and collecting in situ science data on the interstellar medium, that current mission will end around 2030 when their nuclear power supplies can no longer generate enough energy to run any of the instruments. This will leave the Voyagers with its final, singular purpose: To carry that shining circular gift throughout the stars for eons, with the slim but still hopeful possibility that some day another mind in the galaxy will discover it and learn about us.
The Farthest as a Whole
The Farthest is a beautifully crafted documentary on a subject that has been waiting a long time for a proper and respectful treatment. Emer Reynolds love for the subject is evident, inspired by childhood visits to her uncle’s farm in Ireland with its night skies free of light pollution, as she described in this interview:
“A fascination with space began on those farm stays. ‘Mohober House’s sky at night was the opposite to the skies over our home in Dublin. We would drive to Tipperary in our old Hillman Hunter, my dad doing maths puzzles with us all the way, just for fun.
“As night fell, the dark, dark skies overhead would reveal the sparkling cosmos. I was dazzled and in awe of the visible smudge of our Milky Way Galaxy overhead.
“I would spend hours lying on the grass, staring into the blackness. I was dreaming of tumbling through space, hurtling along at 67,000 mph, clutching onto a fragile blue planet.
“Aliens, Horse Head Nebula, star nurseries and time-travel, and exotic distant worlds filled my head as a child. They still do in fact.
“The film is a love story to that awe and wonder I first felt as a child in Tipperary,” Reynolds said.
With its under two-hour running time, The Farthest manages to perform quite the balancing act describing the forty-plus year history of how the Voyagers came to be and what they accomplished. This presentation included interviewing nearly two dozen people, most of whom were either directly involved with the development of the space probes and their science missions, or the creation of the Golden Record – and sometimes both. The documentary goes back and forth between the birth, development, launch, and missions of the Voyagers to the four gas and ice giant worlds dominating the outer realm of our celestial neighborhood – Jupiter, Saturn, Uranus, and Neptune – and the parallel development and contents of the Golden Record.
Had Reynolds et al the time and resources, it would have been fascinating to turn The Farthest into a multi-part documentary. For although the production succeeds in giving an excellent introduction to the overall mission, accomplishments, and the people of the Voyager expeditions, each aspect of these deep space probes could have been given their own documentary for a truly in-depth treatment.
As someone who has followed the Voyager probes since their conception in the Grand Tour plan, I was made keenly aware of various important moments in the Voyager history that were left out, no doubt due in large part to time. Each world system visited and revealed by our intrepid robot explorers could easily be given their own dedicated time.
Here is just one example: While the documentary did talk a bit about the true nature of Jupiter’s Galilean moon Europa, first made known to humanity by the Voyagers in 1979, it was literally just skimming the surface on this alien world. Europa has a global ocean of liquid water at twice the volume of all the water found on Earth that is perhaps sixty miles deep and hidden beneath a crust of ice covered in many long lines and cracks and very few impact craters in comparison. It has been speculated that the ruddy material which permeates these fractures in the ice are organic compounds churned up from the ocean below – and perhaps even include the remains of native aquatic life forms.
In regards to the technical aspects of the Voyager probes themselves, when considering how much The Farthest focused on all the technical troubles the twin Voyagers had when they were launched into the Final Frontier for extra dramatic effect, I was disappointed to witness no mention of the serious problems that Voyager 2 had with its radio receivers well before its one and only encounter with Jupiter.
In April of 1978, the space probe’s main radio receiver permanently failed after an unexpected power surge blew its fuses. Thankfully Voyager’s designers had installed a backup receiver which did activate automatically, although it took an entire week for this to happen as mission controllers had to wait for Voyager 2’s onboard computers to recognize that the probe was not receiving any commands from Earth.
Then the team discovered that the backup receiver was having issues of its own, namely that it could not detect changes in radio signal frequencies due to the failure of its “tracking loop capacitor.” As a result, the probe’s human handlers had to determine which frequency that Voyager 2 was listening to and then send commands on the available channel. This situation remained through every one of its planetary encounters right to the present day.
Had both radio systems failed, Voyager 2’s mission would have been effectively over before it had really begun. Both probes were sophisticated enough to conduct a basic science mission on their own in the event they lost contact with their human controllers, but without a way to relay their precious data back to Earth, no one would ever know what the Voyager had found out there. In the particulars of Voyager 2’s case, not only would we have lost its much closer examination of Europa but also humanity’s first encounters with Uranus and Neptune.
Seeing as we have yet to follow up with any new probe missions after Voyager 2’s singular flybys of those ice giants after a time span of over three decades, the loss to planetary science had the robot explorer gone permanently silent while sailing through the Main Planetoid Belt cannot be overestimated.
I was also surprised that the documentary made no mention, let alone failed to even show, one of the first historic actions one of the probes had done during its mission: Just thirteen days after being launched from Cape Canaveral, Florida, Voyager 1 aimed its cameras at the world it had just left and returned the first image of Earth and its moon captured in a single frame from 7.25 million miles away.
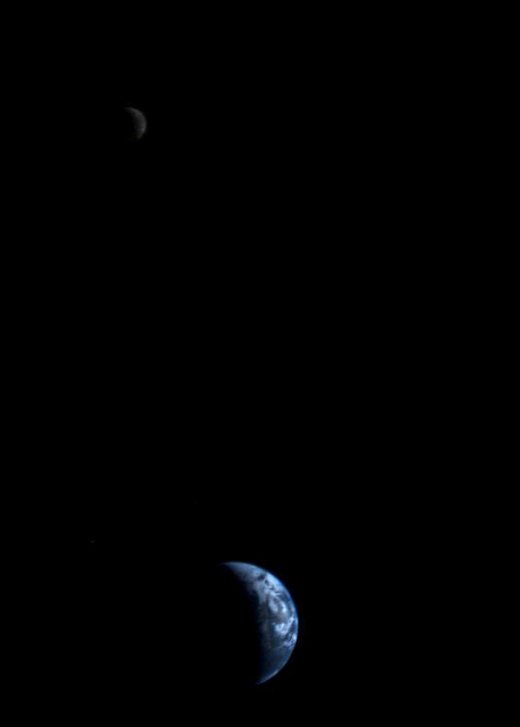
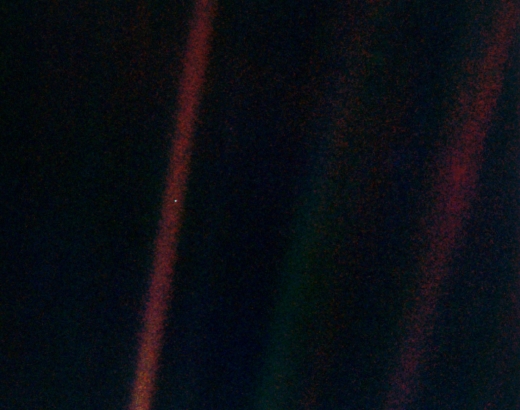
This is probably among the more famous images taken by the two deep space probes – and that is saying something. I wish the documenters had shown Earth and the Moon as Voyager 1 saw it while the robotic explorer was just underway on its long journey and then juxtaposed it with the later segment on the probe’s last image taken in February of 1990, the very famous photograph of our planet as a Pale Blue Dot as seen from the edge of our Sol system. This would have made for a nice counterpoint balance, bringing home just how far the Voyagers had gone not only in terms of distance but also in how much they had revealed to and enlightened the species that built them for this adventure, living back there on that blue globe now so far away in space and time.
The special effects in The Farthest were very nicely done. One standout in particular involved Voyager 1 sailing in front of Jupiter with its Great Red Spot while they played the eerie, screeching radio signals coming from the giant planet. These literally otherworldly sounds turned out to be immense electrical storms far bigger and more powerful than anything generated on Earth.
I also liked how they introduced the segment for each new planet as the Voyagers approached them for the first time. They took numerous still frames taken by the probes of the world as they were being approached and combined them into a video with subdued music playing in the background. This gave the viewer the feeling of how the mission team felt as the alien globes were slowly being revealed in increasing detail by the probes’ electronic eyes.
Another highlight of The Farthest were the interviews of the people who played both direct and indirect roles with the Voyagers and their Golden Records. Among the many standouts were Frank Locatell, Voyager’s Project Engineer, Mechanical Systems, whose expressive and amusing description of how the team had to surreptitiously wrap all of the probes’ external cables with aluminum foil bought from a local grocery store – so that Jupiter’s immense and powerful magnetic field wouldn’t fry the machines into electronic oblivion — is worth watching the documentary for that alone.
Nick Sagan, the third son of Carl Sagan, the famous astronomer and science popularizer who did much to make the Pioneer Plaques and Voyager Records a reality, shared his experiences and thoughts as a young boy who was asked to participate in the creation of the Golden Record. Among the sound sections on the LP were samples of 55 human languages greeting whoever would find the Voyagers and their gifts some day. Nick represented all those people who speak English with the phrase: “Hello from the children of planet Earth.”
The documentary made a point of mentioning throughout that the Voyager probes were over forty years old, meaning their technology was from the 1970s: The year 1972 to be precise, as the spacecraft designs had to be “frozen” five years before the probes’ launch dates. Perhaps to younger ears this seems positively ancient, leaving them to wonder how anyone back then, even NASA, could send automated spaceships billions of miles across hostile space to explore alien planets and moons in working order for more than a decade.
Rich Terrile, Voyager Imaging Science, visually brought home just how wide the technological gulf had become over the past four decades by producing a modern key fob and saying that the processing power of the computer chip inside this little device was comparable to the most advanced – and much larger – artificial brains of that earlier era.
As a nice counterpoint, this demonstration was immediately followed by a clip with Voyager Project Manager John Casani, who asked: “What’s wrong with ’70s technology? I mean, you look at me, I’m [19]30s technology!” Casani added that he makes no apologies for the “limitations that we were working with at the time. We milked the technology for what we could get from it.” Seeing how the Voyagers have lasted well beyond their initial planned encounters with Jupiter and Saturn from 1979 to 1981, with every intention of recording and returning scientific data on the interstellar medium for perhaps two decades more, no apologies are necessary, indeed.
Apparently all of the interviews with the Voyager team members and some of the others shown in The Farthest averaged about three hours each. This is yet another reason to have an entire documentary series on the Voyager probes so that those who want to can hear everything these space pioneers accomplished beyond their tantalizing clips. I also hope that the documentary producers have either already archived or will archive these valuable interviews for the benefit of our historical record on the early Space Age.
Too “Space-y Science-y”?
One surprise taken from various interviews and news items regarding The Farthest was the documentary makers’ desire not to get too “space-y science-y” with their presentation. Here is one example of this attitude straight from Emer Reynolds herself:
“We were trying to find people that would be prepared to talk to us, but more than that – because we wanted to make a film that was very human and tapped into the human side as opposed to dry science,” says Reynolds.
The film, she assures, is not aimed at the “space-y science-y types” – it’s for everyone. It is, at its heart, a human story. “It goes into the heart of what makes us human, the great mysteries that define our existence,” says Reynolds.
Not only are “space-y” and “science-y” not actual words in the English language (plus referring to those who do like such topics as “types” is a bit insensitive and ostracizing), but this flies in the face of the fact that the Voyager missions were all about science, not to mention made possible because of science!
I understand to a degree what the documentary makers were trying to say here, as science can be and has been presented by its practitioners in a fashion that is often less than palatable to those who are not indoctrinated in the various fields of knowledge, even including something as naturally exciting and wondrous as outer space. However, such a statement – and a grammatically poor one at that – does not speak well either about the makers’ perceptions of their audience or the knowledge and interest levels of the audiences themselves.
I also understand that they wanted to be inclusive with their viewing audience, but to throw science under the bus like that is not only an offense to the general public but especially those who would be drawn to the subject matter of their documentary because it is both about a historic time in space science and communicating with intelligent extraterrestrial life.
With the exception of the fact that I wish they would turn this documentary into a series to expand upon the various aspects of the Voyager missions, I thought they did a fairly good job of presenting the space science of each world they visited. They even discussed the wild magnetic field of Uranus, a topic that could easily have become bogged down by someone having to explain its physics to a lay audience.
On the other hand, this explains why the documentary’s discussions on ETI were fairly basic, sticking to standard viewpoints and ideas on alien life and their possible behaviors. I cannot say I was entirely pleased with their use of children’s drawings of aliens as background effects. They tended to focus on portraying extraterrestrials as literal bug-eyed monsters and the big-headed, thin-bodied types from innumerable UFO reports. These depictions only serve to infantilize the subject and keep it from being taken seriously by the scientific community and others. Such stereotypical and immature presentations of aliens certainly do not help the case for the existence of the Golden Records.
It is just sad that our culture is so “afraid” of science or anything that might go above their heads, as if they would get lost and confused rather than learn something new to expand and enlighten their worldviews. After all, isn’t that what space exploration is all about? And the Voyagers did that big time. Plus, if we want future generations of those “space-y science-y types” to forge new missions to other worlds in our vast Cosmos, then documenters and educators need to appeal to them to spark their interest and destinies as much as the casually curious viewer, if not more so.
On the Record
The makers of The Farthest worried that too much impersonal science in their documentary would turn away potential viewers, whom they perceived as uncomfortable with the subject matter. In an ironic contrast, a number of the makers and practitioners of the Voyager probes were even more concerned that one particular item being added to the twin vessels were of no scientific value at all.
Jared Lipworth, a consulting producer with HHMI Tangled Bank Studios, which collaborated with the production company Crossing The Line to present The Farthest, stated the situation succinctly in this interview:
“The scientists at the time, a lot of them, did not want to have anything to do with it,” Lipworth said. “They did not want it on [the spacecraft] and didn’t like it was getting all the attention. But that says a lot about humanity. It was as much for us as it was for any alien that might find it.”
The Farthest provides a good deal of evidence for these reaction to the Golden Records from the scientific and engineering quarters of the Voyager team. Several members confirm this during their interviews, including Frank Drake, the famed SETI pioneer who was also heavily involved with designing both the Pioneer Plaques and the Voyager Records. NASA also showed their ambivalence towards the records: In their early press releases depicting photographs and diagrams of the probes, the Voyagers were often shown with their sides which did not include the familiar disc, as if by hiding the record the space agency could avoid having to discuss it. Being perhaps the most relatable and intriguing aspect of the robotic vessels to the general public, this ploy naturally failed.
The documentary also revealed that the official NASA press conference for the Golden Record was shunted off to a nearby second-rate motel. Held just days after Voyager 2 was lofted skyward, record team member Timothy Ferris relayed how he and his fellow collaborators had to compete with the music and general noise from a Polish wedding going on nearby, separated only by a large partition. The scenario is initially amusing until you grasp just how insulting the whole production was to the record team and the concept. However, as with NASA’s attempts to hide the pesky disc within their media documentation, their efforts at obnubilation were ultimately futile.
The space agency did make one last attempt to physically remove the Golden Record from Voyager. Ferris, who was in charge of procuring the music selections, wanted to include a short engraved dedication message in the blank spaces of the record between its takeout grooves: “To the makers of music – all worlds, all times.” Ferris was inspired to do this by John Lennon of The Beatles, who in turn recommended his studio engineer, Jimmy Iovine, to help with the production of the records.
This seemingly harmless act did not sit well with NASA, as the words were not included in the very detailed specifications for the Voyager probes. The agency was ready to replace the records with blank discs. Only the intervention of Carl Sagan speaking with the NASA Administrator kept the Golden Records attached to their spacecraft. Using a bit of poetry, Sagan pointed out that the dedication was the only example of human handwriting aboard the Voyagers – although it would not surprise me if a few folks snuck in their signatures and perhaps even a note or two during the assembly process. This was and is a common behavior in the history of lunar and planetary exploration.
The Golden Records do indeed have scientific value – certainly to those who may find them one day, but also for humanity itself. They provide a sociological and psychological study of how we may present ourselves to others, in particular others who are highly intelligent but not necessarily human. Then there was the need for developing technologies and sciences to make these presentations viable aboard a spaceship that has to last a very long time drifting in the interstellar medium and remain readable by non-human beings. The records did not need to have a scientific reason to be a part of the Voyager missions despite the protests, but there they are along with several others, no doubt.
For someone like me, who has immersed himself for a lifetime moving about the worlds of science and the humanities/arts, it is hard to imagine how those who can dream of exploring the stars and all their unknowns – plus actually do something to make those dreams a reality – could simultaneously dismiss and even feel embarrassed and hostile to the idea of life elsewhere, including those capable of finding the probe and its shiny metal gift. However, as consulting producer Jeremy Lipworth said, this “says a lot about humanity,” which is the whole point for the existence of the Golden Record.
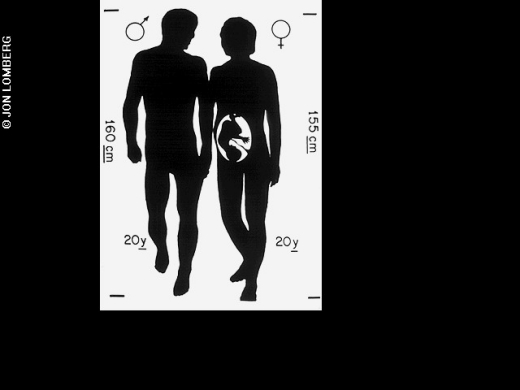
On the plus side, it was nice to see several Voyager team members defending what was on the Golden Records, in particular how certain images were not offensive despite public opinion and NASA’s concerns about offending those tax payers. This stemmed from the Golden Records’ predecessors, the Pioneer Plaques, which depicted a representation of a male and female human without any clothing upon them. People complained that the space agency was sending “smut” into space among other issues such as the positions of the man’s appendages compared to the woman, who just seemed to be standing there passively.
Having much more room to work with in comparison to the plaques, the Golden Records used this extra space to show any recipients how humans reproduce – within limits, of course. One photograph initially chosen showed a man and woman – nude again – holding hands and smiling at each other. The woman was clearly pregnant, or at least her condition is apparent to any adult human. NASA rejected this image out of fear of more public backlash, so Voyager Record team artist Jon Lomberg had to replace the tasteful photograph with a silhouette of the couple. This replacement at least had the advantage of showing the fetus developing in the woman’s womb as part of the reproduction story.
In a bit of irony, while the original photograph of the expectant couple was shown in the theatrical release of The Farthest, when the documentary arrived on PBS Television and elsewhere, someone had replaced the nude man and woman with the Lomberg silhouette! If you must see the original image, it may be found in the official book on the Golden Records titled Murmurs of Earth: The Voyager Interstellar Record (Random House, 1978), authored by all of the main team members. This is a work that anyone interested in communicating with ETI and Space Age history must have in their library. It would be quite interesting to see how our contemporary prudery might affect the understanding of any record recipients when it came to explaining how the beings who made this by-then ancient artifact and its means of transportation also made copies of themselves.
Speaking of changes to The Farthest between its transition from the cinema to the television screen, I noted in the segment on the Pale Blue Dot where there is a vignette depicting various scenes of human activity on Earth, the whole piece was inexplicably removed from the documentary’s presentation on Netflix (it remained intact in its PBS incarnation).
The scene was a nice visual accompaniment on Carl Sagan’s wonderful explanation during a NASA press conference from 1990 of the last image Voyager 1 ever took, less than one year after its twin probe had successfully flown through the Neptune system. A celebration of human life on Earth in a series of wordless images set to music, it shows what we are, the good and the bad, without becoming too graphic in either direction.
This is somewhat ironic, as the Voyager Record team decided early on only to present the Cosmos with our best face forward so as not to inadvertently frighten or offend any recipients with our less sanguine qualities. Only some of the music pieces give hints to the records’ listeners that we are less than ideal, perfect creatures – though they may be able to figure this out anyway just by examining the Voyagers, which will undoubtedly seem incredibly primitive to them, since we assume those who find the space probes will be experts at interstellar travel and detecting small inert alien vessels in the dark and cold of deep space.
As for this unexpected edit to The Farthest, I must wonder if anyone at Netflix consulted with the documentary makers before making this cut, or if they just decided to second-guess the artists’ decision for reasons I do not readily see, either practical or aesthetic. Removing this celebration of the Pale Blue Dot may have done no permanent damage to The Farthest in terms of conveying information about the Voyager missions, but it did diminish a bit what made this documentary a cut above those works which are in essence a dry recitation of facts.
Having pointed out what was removed from The Farthest, this is a good time and place to state my desire for there to have been much more of and about the contents of the Golden Record in the documentary. Naturally they played samples of the record’s actual sounds, voices, images, and music throughout the film: The very first scene displayed a reproduction of part of the letter written by then U.S. President Jimmy Carter specifically for the Golden Record and its recipients. The interview with Nick Sagan gave an illuminating background as to what it was like putting the language segments together, at least in one particular case.
It was also fun to see the Saturday Night Live origin of the joke that any aliens who listened to the record would respond with “Send more Chuck Berry!” given by comedian Steve Martin. Later on we were treated to the amazing moment when, during a celebration of the wildly successful Voyager missions in 1989, both Chuck Berry and Carl Sagan got up together on stage at the Jet Propulsion Laboratory (JPL) in Pasadena, California, singing and dancing to the musician’s hit single, “Johnny B. Goode” – the only representation of rock-and-roll music among the Golden Record’s 27 international songs.
With the highlights of the positive aspects of the Golden Record as shown in The Farthest duty noted, this documentary made me realize just how much I wanted to see far more about that grooved disc and its contents. Just as its story could and did fill an entire book along with countless articles and stories in the intervening years, the Voyager Interstellar Record deserves its own film documentary to do it proper justice in presenting itself to the vast majority of humanity. After all, it was explicitly designed to be our representative to the rest of the Milky Way galaxy, so I say the species that it speaks for should be given the chance to really see the Golden Record should they so desire it.
Of the two hours of samples from humanity and our world, over ninety minutes of the record’s offerings are devoted to global music. The Farthest gave most of its time in regards to the music to Chuck Berry’s landmark song. Certainly at least for Western audiences, “Johnny B. Goode” was probably among the best known of all the record pieces. It also had the benefit of very relevant and entertaining visuals to go with it.
Berry’s pioneering rock-and-roll number was not the only well-known song on the Golden Record, however. Even those who may know little about Ludwig van Beethoven know at least the first few bars of his Fifth Symphony, which are now preserved for eons in deep space. As for my earlier mention of how the record music contains the few indications that humanity is an imperfect species, “Dark Was the Night, Cold Was the Ground” by blues musician Blind Willie Johnson was chosen, in the words of Timothy Ferris in Murmurs of Earth:
“Johnson’s song concerns a situation he faced many times: Nightfall with no place to sleep. Since humans appeared on Earth, the shroud of night has yet to fall without touching a man or woman in the same plight.”
The final song on the Golden Record, which immediately follows Johnson’s number, was another Beethoven piece: The String Quartet No. 13 in B flat, Opus 130, Cavatina. It is a melancholy number made at a particularly dark time in the fading years of the composer’s life. However, this piece of music, like the being and species who made it, is neither simple nor provides simple answers to its meanings, as I quote Ferris once again from Murmurs of Earth:
“But sadness alone can’t define the Cavatina. Strains of hope run through it as well, and something of the serenity of a man who has endured suffering and come to terms with existence perceived without illusion.
“It may be that these ambiguities make for an appropriate conclusion to the Voyager record. We who are living the drama of human life on Earth do not know what measure of sadness or hope is appropriate to our existence. We do not know whether we are living a tragedy or a comedy or a great adventure. The dying Beethoven had no answers to these questions, and knew he had no answers, and had learned to live without them. In the Cavatina, he invites us to stare that situation in the face.”
There was also a recording of the thoughts of Voyager Record team member Ann Druyan conducted on an EEG machine, where she consciously pondered various historical ideas, events, and persons for one hour, along with “the exception of a couple of irrepressible facts” from her life. This part of the record’s development also did not appear in The Farthest, along with the conspicuous absence of Druyan herself. With both Druyan and Carl Sagan largely removed from having a direct influence on the documentary – Sagan passed away in December of 1996 from myelodysplasia, although clips of him conducting earlier interviews permeate the film and provide some measure of his presence there – I was left to wonder how the Golden Record might have been presented had the couple been around for their input, especially together.
The makers of The Farthest emphasized multiple times how much they wanted to bring out the human aspects of the Voyager missions. They did accomplish this, but as my examples have shown, there is so much more that was left untapped by this documentary which needs to be shared with the widest audiences possible. When you are trying to describe a complex and incredibly productive space expedition that is half a century in its making and undertaking in less than two hours aimed at an audience that is curious but not expected to be very knowledgeable about its subject matter, the best you can achieve is a sampler of the Voyager missions.
For those who care, The Farthest can only serve to whet one’s appetite for more. That a full-on documentary series or even a historical film (or mini-series) about the Golden Records has yet to be made after all this time is surprising, given all the depth, drama, and excitement that went into their realization.
I do not count John Carpenter’s 1984 science fiction film Starman as a proper answer to my request. Although it is a well-done film, the Golden Record only serves as the catalyst for the rest of the story. Besides, the film had The Rolling Stone’s 1965 song “(I Can’t Get No) Satisfaction” as part of the music selection on the record, which is patently false. Plus, if the ETI captured Voyager 2 in space in 1984, this would presumably disrupt its mission to the planet Uranus two years later and Neptune three years after that. We did not witness if the aliens released the space probe back onto its flight path, but the visiting ETI’s scout ship was later found on Earth with the Golden Record inside it, thus denying other potential recipients of the Voyager the chance to encounter the disc and its contents, presuming the robotic craft was allowed to continue on its cosmic journey. The aliens interpreted the record’s messages as a peaceful invitation to our world, which they did with a representative of their advanced species – only to have their scout ship and its lone occupant shot down by a missile.
There especially needs to be driven home the fact that Voyager 1 and 2 are now on their final, ultimate mission as ambassadors of Earth and humanity to the rest of the galaxy. Yes, they are still functioning and taking important measurements of the interstellar medium, but the reasons they were sent into space in the first place are now long behind them. What the Voyagers did was both extraordinary and ground-breaking for planetary science, of course, but now other deep space probes have followed in their paths, with more sophisticated instrumentation and revealing data that surpasses their mechanical ancestors. That is the evolution of planetary exploration.
Humanity is a short-lived species, both individually and culturally. Human life spans average about eighty years at present, while we have only had any semblance of a civilized society for roughly six thousand years – mere drops in the cosmic bucket as the phrase goes. The Voyager Records will last for at least one billion years if not much longer even by conservative estimates of their survivability in interstellar space.
To contrast and compare: One billion years ago, Earth’s first multicellular plants were just starting to move onto dry land from the oceans. The evolution of more sophisticated terrestrial creatures were still hundreds of million years in the future. The Voyagers may even survive the demise of Sol and Earth, assuming our planetary system has not already undergone some radical transformation – natural or otherwise – before then.
This is why the actions of a relatively small collection of humans forty years ago to boldly charge into the void called space and simultaneously dare to imagine communicating with unknown alien intelligences in some unimaginable far future time – all with technologies that were becoming obsolete before they even completed their first mission milestones – are an incredible and deeply important story that must be told now and for the edification of our descendants. Sharing our past with our future should and must be done the way the Voyager missions and the Golden Records were put together, as a complimenting fusion of science and artistry.
The Farthest was a very good start, but the tale has hardly even begun.
To see more about this documentary along with the Voyager space probes and the Golden Records, visit the official PBS Television Web site.
OSIRIS-REx: Long Approach to Bennu
With a robotic presence at Ryugu, JAXA’s Hayabusa2 mission is showing what can be done as we subject near-Earth asteroids to scrutiny. We’ll doubtless learn a lot about asteroid composition, all of which can factor into, among other things, the question of how we would approach changing the trajectory of any object that looked like it might come too close to Earth. The case for studying near-Earth asteroids likewise extends to learning more about the evolution of the Solar System.
NASA’s first near-Earth asteroid visit will take place on December 3, when the OSIRIS-REx mission arrives at asteroid Bennu, with a suite of instruments including the OCAMS camera suite (PolyCam, MapCam, and SamCam), the OTES thermal spectrometer, the OVIRS visible and infrared spectrometer, the OLA laser altimeter, and the REXIS x-ray spectrometer. Like Hayabusa2, this mission is designed to collect a surface sample and return it to Earth.
And while Hayabusa2 has commanded the asteroid headlines in recent days, OSIRIS-REx has been active in adjusting its course for the December arrival. The first of four asteroid approach maneuvers (AAM-1) took place on October 1, with the main engine thrusters braking the craft relative to Bennu, slowing the approach speed by 351.298 meters per second. The current speed is 140 m/sec after a burn that consumed on the order of 240 kilograms of fuel.
Science operations began on August 17, with PolyCam taking optical navigation images of Bennu on a Monday, Wednesday and Friday cadence until the AAM-1 burn, and then moving to daily ‘OpNavs’ afterwards. The MapCam camera is also taking images that measure changes in reflected light from Bennu’s surface as sunlight strikes it at a variety of angles, which helps to determine the asteroid’s albedo as we measure light reflection from various angles.
The AAM-1 maneuver is, as I mentioned above, the first in a series of four designed to slow the spacecraft to match Bennu’s orbit. Asteroid Approach Maneuver-2 is to occur on October 15. As the approach phase continues, OSIRIS-REx has three other high-priority tasks:
- To observe the area near the asteroid for dust plumes or natural satellites and continue the study of Bennu’s light and spectral properties
- To jettison the protective cover of the craft’s sampling arm and extend the arm in mid-October
- To use OCAMS to show the shape of the asteroid by late October. By mid-November, OSIRIS-REx should begin to detect surface features.
It was in August that the PolyCam camera obtained the first image from 2.2 million kilometers out. Subsequently, the MapCam image below was obtained.
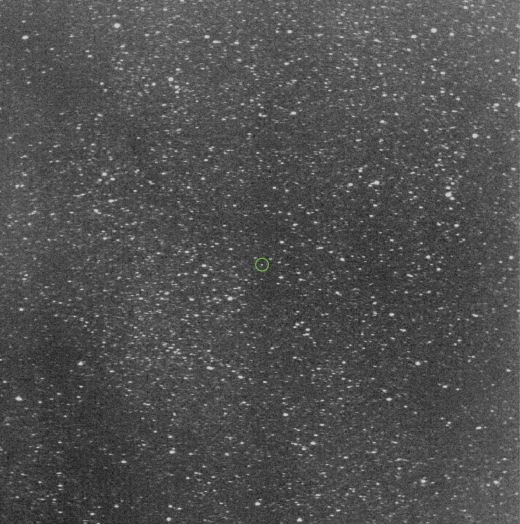
Image: This MapCam image of the space surrounding asteroid Bennu was taken on Sept. 12, 2018, during the OSIRIS-REx mission’s Dust Plume Search observation campaign. Bennu, circled in green, is approximately 1 million km from the spacecraft. The image was created by co-adding 64 ten-second exposures. Credit: NASA/Goddard/University of Arizona.
Bennu shows up here as little more than a dot in an image that is part of OSIRIS-REx’s search for dust and gas plumes on Bennu’s surface. These could present problems during close operations around the object, and could also provide clues about possible cometary activity. The search did not turn up any dust plumes from Bennu, but a second search is planned once the spacecraft arrives.
The first month at the asteroid will be taken up with flybys of Bennu’s north pole, equator and south pole at distances between 19 and 7 kilometers, allowing for direct measurements of its mass as well as close observation of the surface. The surface surveys will allow controllers to identify two possible landing sites for the sample collection, which is scheduled for early July, 2020. OSIRIS-REx will then return to Earth, ejecting the Sample Return Capsule for landing in Utah in September of 2023.
The latest image offered up by the OSIRIS-REx team is an animation showing Bennu brightening during the approach from mid-August to the beginning of October.
Image: This processed and cropped set of images shows Bennu (in the center of the frame) from the perspective of the OSIRIS-REx spacecraft as it approaches the asteroid. During the period between August 17 and October 1, the spacecraft’s PolyCam imager obtained this series of 20 four-second exposures every Monday, Wednesday, and Friday as part of the mission’s optical navigation campaign. From the first to the last image, the spacecraft’s range to Bennu decreased from 2.2 million km to 192,000 km, and Bennu brightened from approximately magnitude 13 to magnitude 8.8 from the spacecraft’s perspective. Date Taken: Aug. 17 – Oct. 1, 2018. Credit: NASA/Goddard/University of Arizona.
Of all the OSIRIS-REx images I’ve seen so far, I think the one below is the prize. But then, I always did like taking the long view.
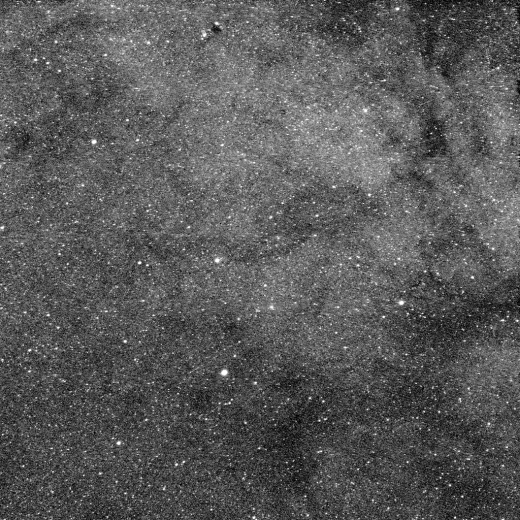
Image: On July 16, 2018, NASA’s OSIRIS-REx spacecraft obtained this image of the Milky Way near the star Gamma2 Sagittarii during a routine spacecraft systems check. The image is a 10 second exposure acquired using the panchromatic filter of the spacecraft’s MapCam camera. The bright star in the lower center of the image is Gamma2 Sagittarii, which marks the tip of the spout of Sagittarius’ teapot near the center of the galaxy. The image is roughly centered on Baade’s Window, one of the brightest patches of the Milky Way, which fills approximately one fourth of the field of view. Relatively low amounts of interstellar dust in this region make it possible to view a part of the galaxy that is usually obscured. By contrast, the dark region near the top of the image, the Ink Spot Nebula, is a dense cloud made up of small dust grains that block the light of stars in the background. MapCam is part of the OSIRIS-REx Camera Suite (OCAMS) operated by the University of Arizona. Date Taken: July 16, 2018. Credit: NASA/GSFC/University of Arizona.
We’re 53 days from arrival at Bennu. You can follow news of OSIRIS-REx at its NASA page or via Twitter at @OSIRIS-REx. Dante Lauretta (Lunar and Planetary Laboratory) is principal investigator on the mission; the University of Arizona OSIRIS-REx page is here. And be sure to check Emily Lakdawalla’s excellent overview of operations at Bennu in the runup to arrival.
MASCOT Operations on Asteroid Ryugu
To me, the image below is emblematic of space exploration. We look out at vistas that have never before been seen by human eye, contextualized by the banks of equipment that connect us to our probes on distant worlds. The fact that we can then sling these images globally through the Internet, opening them up to anyone with a computer at hand, gives them additional weight. Through such technologies we may eventually recover what we used to take for granted in the days of the Moon race, a sense of global participation and engagement.
We’re looking at the MASCOT Control Centre at the German Aerospace Center (Deutsches Zentrum für Luft- und Raumfahrt; DLR) in Cologne, where the MASCOT lander was followed through its separation from the Japanese Hayabusa2 probe on October 3, its landing on asteroid Ryugu, and the end of the mission, some 17 hours later.
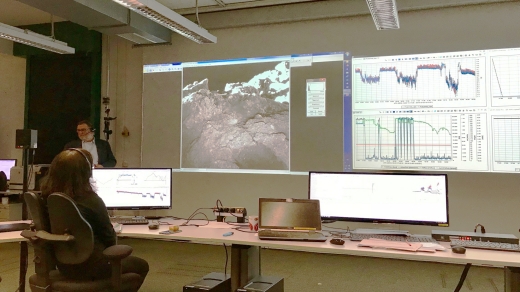
Image: In the foreground is MASCOT project manager Tra-Mi Ho from the DLR Institute of Space Systems in Bremen at the MASCOT Control Centre of the DLR Microgravity User Support Centre in Cologne. In the background is Ralf Jaumann, scientific director of MASCOT, presenting some of the 120 images taken with the DLR camera MASCAM. Credit: DLR.
As scientists from Japan, Germany and France looked on, MASCOT (Mobile Asteroid Surface Scout) successfully acquired data about the surface of the asteroid at several locations and safely returned its data to Hayabusa2 before its battery became depleted. A full 17 hours of battery life allowed an extra hour of operations, data collection, image acquisition and movement to various surface locations.
MASCOT is a mobile device, capable of using its swing-arm to reposition itself as needed. Attitude changes can keep the top antenna directed upward while the spectroscopic microscope faces downwards, a fact controllers put to good use. Says MASCOT operations manager Christian Krause (DLR):
“After a first automated reorientation hop, it ended up in an unfavourable position. With another manually commanded hopping manoeuvre, we were able to place MASCOT in another favourable position thanks to the very precisely controlled swing arm.”
MASCOT moved several meters to its early measuring points, with a longer move at the last as controllers took advantage of the remaining battery life. Three asteroid days and two asteroid nights, with a day-night cycle lasting 7 hours and 36 minutes, covered the lander’s operations.
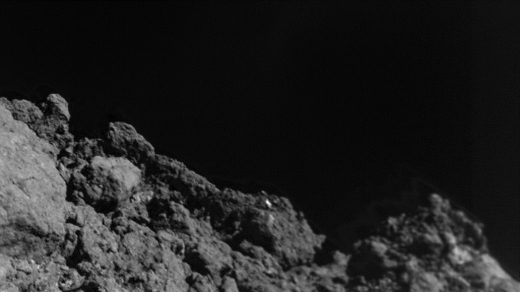
Image: The images acquired with the MASCAM camera on the MASCOT lander during the descent show an extremely rugged surface covered with numerous angular rocks. Ryugu, a four-and-a-half billion year-old C-type asteroid has shown the scientists something they had not expected, even though more than a dozen asteroids have been explored up close by space probes. On this close-up, there are no areas covered with dust — the regolith that results from the fragmentation of rocks due to exposure to micrometeorite impacts and high-energy cosmic particles over billions of years. The image from the rotating MASCOT lander was taken at a height of about 10 to 20 meters. Credit: MASCOT/DLR/JAXA.
The dark surface of Ryugu reflects about 2.5 percent of incoming starlight, so that in the image below, the area shown is as dark as asphalt. According to DLR, the details of the terrain can be captured because of the photosensitive semiconductor elements of the 1000 by 1000 pixel CMOS (complementary metal-oxide semiconductor) camera sensor, which can enhance low light signals and produce usable image data.
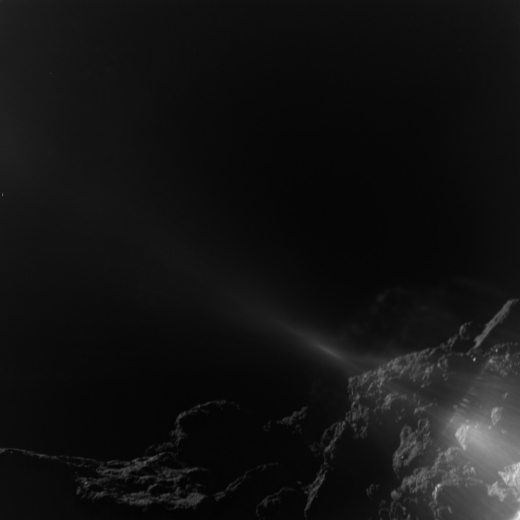
Image: DLR’s MASCAM camera took 20 images during MASCOT’s 20-minute fall to Ryugu, following its separation from Hayabusa2, which took place at 51 meters above the asteroid’s surface. This image shows the landscape near the first touchdown location on Ryugu from a height of about 25 to 10 meters. Light reflections on the frame structure of the camera body scatter into the field of vision of the MASCAM (bottom right) as a result of the backlit light of the Sun shining on Ryugu. Credit: MASCOT/DLR/JAXA.
We now collect data and go about evaluating the results of MASCOT’s foray. The small lander had a short life but it seems to have delivered on every expectation. As Hayabusa2 operations continue at Ryugu, we’ll learn a great deal about the early history of the Solar System and the composition of near-Earth asteroids like these, all of which we’ll be able to weigh against what we find at asteroid Bennu when the OSIRIS-REx mission reaches its target in December.
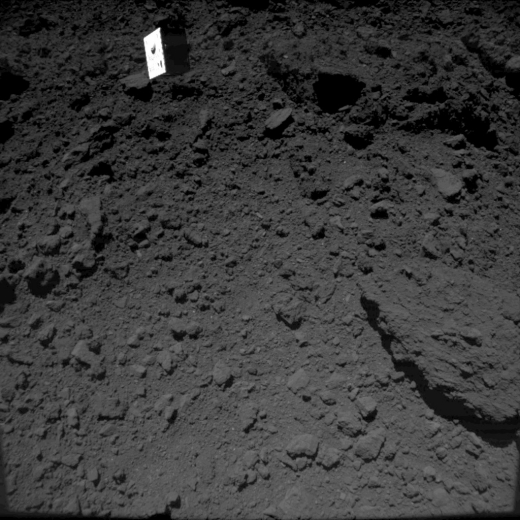
Image: MASCOT as photographed by the ONC-W2 immediately after separation. MASCOT was captured on three consecutively shot images, with image capture times between 10:57:54 JST – 10:58:14 JST on October 3. Since separation time itself was at 10:57:20 JST, this image was captured immediately after separation. The ONC-W2 is a camera attached to the side of the spacecraft and is shooting diagonally downward from Hayabusa2. This gives an image showing MASCOT descending with the surface of Ryugu in the background. Credit: JAXA, University of Tokyo, Kochi University, Rikkyo University, Nagoya University, Chiba Institute of Technology, Meiji University, University of Aizu, AIST.
Bear in mind that the the 50th annual meeting of the Division for Planetary Sciences (DPS) of the American Astronomical Society (AAS) is coming up in Knoxville in late October. Among the press conferences scheduled are one covering Hayabusa2 developments and another the latest from New Horizons. The coming weeks will be a busy time for Solar System exploration.
Voyager 2’s Path to Interstellar Space
I want to talk about the Voyagers this morning and their continuing interstellar mission, but first, a quick correction. Yesterday in writing about New Horizons’ flyby of MU69, I made an inexplicable gaffe, referring to the event as occurring on the 19th rather than the 1st of January (without my morning coffee, I had evidently fixated on the ’19’ of 2019). Several readers quickly spotted this in the article’s penultimate paragraph and I fixed it, but unfortunately the email subscribers received the uncorrected version. So for the record, we can look forward to the New Horizons flyby of MU69 on January 1, 2019 at 0533 UTC. Sorry about the error.
Let’s turn now to the Voyagers, and the question of how long they will stay alive. I often see 2025 cited as a possible terminus, with each spacecraft capable of communication with Earth and the operation of at least one instrument until then. If we make it to 2025, then Voyager 1 would be 160 AU out, and Voyager 2 will have reached 135 AU or thereabouts. In his book The Interstellar Age, Jim Bell — who worked as an intern on the Voyager science support team at JPL starting in 1980, with Voyager at Saturn — notes that cycling off some of the remaining instruments after 2020 could push the date further, maybe to the late 2020s.
After that? With steadily decreasing power levels, some heaters and engineering subsystems will have to be shut down, and with them the science instruments, starting with the most power-hungry. Low-power instruments like the magnetometer could likely stay on longer.
And then there’s this possibility. Stretching out their lifetimes might demand reducing the Voyagers’ output to an engineering signal and nothing else. Bell quotes Voyager project scientist Ed Stone: “As long as we have a few watts left, we’ll try to measure something.”
Working with nothing more than this faint signal, some science could be done simply by monitoring it over the years as it recedes. Keep Voyager doing science until 2027 and we will have achieved fifty years of science returns. Reduced to that single engineering signal, the Voyagers might stay in radio contact until the 2030s.
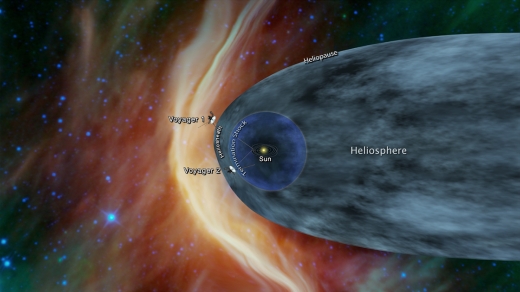
Image: This graphic shows the position of the Voyager 1 and Voyager 2 probes, relative to the heliosphere, a protective bubble created by the Sun that extends well past the orbit of Pluto. Voyager 1 crossed the heliopause, or the edge of the heliosphere, in 2012. Voyager 2 is still in the heliosheath, or the outermost part of the heliosphere. Credit: NASA/JPL-Caltech.
Bear in mind the conditions the Voyagers have to deal with even now. With more than 25 percent of their plutonium having decayed, power limitations are a real factor. If either Voyager passed by an interesting inner Oort object, the cameras could not be turned on because of the power drain, which would shut down their heaters. Continuing power demands from radio communications and the heaters create thorny problems for controllers.
Even so, we’re still doing good science. Today the focus is on a still active Voyager 2, which may be nearing interstellar space. Voyager 2 is now 17.7 billion kilometers from Earth, about 118 AU, and has been traveling through the outermost layers of the heliosphere since 2007. The solar wind dominates this malleable region, which changes during the Sun’s eleven year activity cycle. Solar flares and coronal mass ejections all factor into its size and shape. Ahead is the heliosphere’s outer boundary, the heliopause, beyond which lies interstellar space.
The Cosmic Ray Subsystem instrument on Voyager 2 is now picking up a 5 percent increase in the rate of cosmic rays hitting the spacecraft as compared with what we saw in early August. Moreover, the Low-Energy Charged Particle instrument is picking up an increase in higher-energy cosmic rays. The increases parallel what Voyager 1 found beginning in May, 2012, about three months before it exited the heliopause.
So we may be about to get another interstellar spacecraft. Says Ed Stone:
“We’re seeing a change in the environment around Voyager 2, there’s no doubt about that. We’re going to learn a lot in the coming months, but we still don’t know when we’ll reach the heliopause. We’re not there yet — that’s one thing I can say with confidence.”
We haven’t crossed the outer regions of the heliosphere with a functioning spacecraft more than once, so there is a lot to learn. Voyager 2 moves through a different part of the outer heliosphere — the heliosheath — than Voyager 1 did, so we can’t project too much into the timeline. We’ll simply have to keep monitoring the craft to see what happens.
What an extraordinary ride it has been, and here’s hoping we can keep both Voyagers alive as long as possible. Even when their power is definitively gone, they’ll still be inspiring our imaginations. We’re 300 years from the Inner Oort Cloud, and a whopping 30,000 years from the Oort Cloud’s outer edge. In 40,000 years, Voyager 2 will pass about 110,000 AU from the red dwarf Ross 248, which will at that time be the closest star to the Sun. Both spacecraft will eventually follow 250-million year orbits around the center of the Milky Way.
I return to Jim Bell, who waxes poetic at the thought. He envisions a far future when our remote descendants may be able to see the Voyagers again. Here is a breathtaking vision indeed:
Over time — enormous spans of time, as the gravity of passing stars and interacting galaxies jostles them as well as the stars in our galaxy — I imagine that the Voyagers will slowly rise out of the plane of our Milky Way, rising, rising ever higher above the surrounding disk of stars and gas and dust, as they once rose above the plane of their home stellar system. If our far-distant descendants remember them, then our patience, perseverance, and persistence could be rewarded with perspective when our species — whatever it has become — does, ultimately, follow them. The Voyagers will be long dormant when we catch them, but they will once again make our spirits soar as we gaze upon these most ancient of human artifacts, and then turn around and look back. I have no idea if they’ll still call it a selfie then, but regardless of what it’s called, the view of our home galaxy, from the outside, will be glorious to behold.
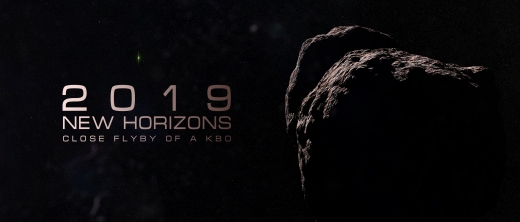
Fine-Tuning New Horizons’ Trajectory
I love the timing of New Horizons’ next encounter, just as we begin a new year in 2019. On the one hand, we’ll be able to look back to a mission that has proven successful in some ways beyond the dreams of its creators. On the other hand, we’ll have the first close-up brush past a Kuiper Belt Object, 2014 MU69 or, as it’s now nicknamed, Ultima Thule. This farthest Solar System object ever visited by a spacecraft may, in turn, be followed by yet another still farther, if all goes well and the mission is extended. This assumes, of course, another target in range.
We can’t rule out a healthy future for this spacecraft after Ultima Thule. Bear in mind that New Horizons seems to be approaching its current target along its rotational axis. That could reduce the need for additional maneuvers to improve visibility for the New Horizons cameras, saving fuel for later trajectory changes if indeed another target can be found. The current mission extension ends in 2021, but another extension would get a powerful boost if new facilities like the Large Synoptic Survey Telescope become available, offering more capability at tracking down an appropriate KBO. Hubble and New Horizons itself will also keep looking.
But even lacking such a secondary target, an operational New Horizons could return useful data about conditions in the outer Solar System and the heliosphere, with the spacecraft’s radioisotope thermoelectric generator still producing sufficient power for some years. I’ve seen a worst-case 2026 as the cutoff point, but Alan Stern is on record as saying that the craft has enough hydrazine fuel and power from its plutonium generator to stay functional until 2035.
By way of comparison with Voyager, which we need to revisit tomorrow, New Horizons won’t reach 100 AU until 2038, nicely placed to explore the heliosphere if still operational.
But back to Ultima Thule, a destination now within 112 million kilometers of the spacecraft. New Horizons is closing at a rate of 14.4 kilometers per second, enroute to what the New Horizons team says will need to be a 120 by 320 kilometer ‘box’ in a flyby that needs to be predicted within 140 seconds. Based on what we saw at Pluto/Charon, these demands can be met.
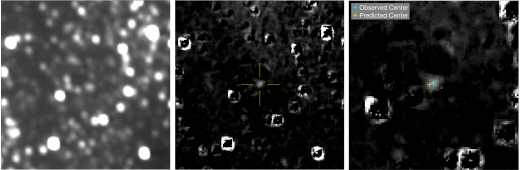
Image: At left, a composite optical navigation image, produced by combining 20 images from the New Horizons Long Range Reconnaissance Imager (LORRI) acquired on Sept. 24. The center photo is a composite optical navigation image of Ultima Thule after subtracting the background star field; star field subtraction is an important component of optical navigation image processing since it isolates Ultima from nearby stars. At right is a magnified view of the star-subtracted image, showing the close proximity and relative agreement between the observed and predicted locations of Ultima. Credit: NASA/JHUAPL/SwRI/KinetX.
Above are the latest navigation images from New Horizons’ Long Range Reconnaissance Imager (LORRI). An engine burn on October 3 further tightened location and timing information for the New Year’s flyby, a 3 ½ minute maneuver that adjusted the spacecraft’s trajectory and increased its speed by 2.1 meters per second. Records fall every time New Horizons does this, with the October 3 correction marking the farthest course correction ever performed.
It’s interesting to learn, too, that this is the first time New Horizons has made a targeting maneuver for the Ultima Thule flyby that used pictures taken by New Horizons itself. The ‘aim point’ is 3,500 kilometers from Ultima at closest approach, and we’ve just learned that these navigation images confirm that Ultima is within 500 kilometers of its expected position.
“Since we are flying very fast and close to the surface of Ultima, approximately four times closer than the Pluto flyby in July 2015, the timing of the flyby must be very accurate,” said Derek Nelson, of KinetX Aerospace, Inc., New Horizons optical navigation lead. “The images help to determine the position and timing of the flyby, but we must also trust the prior estimate of Ultima’s position and velocity to ensure a successful flyby. These first images give us confidence that Ultima is where we expected it to be, and the timing of the flyby will be accurate.”
I’m already imagining New Year’s eve with Ultima Thule to look forward to. You can adjust your own plans depending on your time zone, but the projected flyby time is 0533 UTC on the 1st. As with Pluto/Charon, the excitement of the encounter continues to build. In the broader picture, the more good science we do in space, the more drama we produce as we open up new terrain. This week alone, we need to look at the Hayabusa2 operations at Ryugu, the upcoming OSIRIS-REx exploration of asteroid Bennu, and the continuing saga of Voyager 2.
But New Horizons also reminds us of an uncomfortable fact. When it comes to the outer system, this is the only spacecraft making studies of the Kuiper Belt from within it, and there is no other currently planned. Data from this mission will need to carry us for quite some time.
Follow with RSS or E-Mail
