Centauri Dreams
Imagining and Planning Interstellar Exploration
The Essence of the Human Spirit: Apollo 8
I think of Apollo 8 in terms of transformation. As Al Jackson explains so well in the essay that follows, a lunar mission in December of 1968 seemed impossible for NASA and pushed technologies and procedures not yet tested into immediate action. But if Frank Borman, Jim Lovell and Bill Anders got Apollo back on its arbitrary and highly dangerous schedule, they did something as well for a college kid watching on TV that savage year. Seeing the crew’s images of the lunar surface and hearing their reading from Genesis on Christmas Eve knowing that their lives hung in the balance later that night turned me into an optimist. We must never devalue human accomplishment with the self-congratulatory irony so prevalent in the post-Apollo period. No, Apollo 8 was huge. It distilled our values of passion, courage and commitment, and its example will resonate long after we’ve sent our first probes to the stars.
By Albert Jackson
“Please be informed there is a Santa Claus”
— Jim Lovell (Post TEI December 25 1968)
“Sir, it wasn’t how you looked, it was how you smelled.”
— Navy Seal frogman to astronaut William Anders, explaining his reaction to opening the Apollo 8 capsule.

Author’s Personal Note: I was 28 years old in December 1968, and had aimed myself at space ever since reading the Collier’s magazine spaceflight series. The first issue was March 22 1952, when I was 11 years old. The series came to an end in the April 30, 1954 issue that asked ‘Can We Get to Mars?’ I was 13 then and remember Wernher Von Braun writing that it would take 25 years to get to Mars, I was downcast! That was too long. I came to the Manned Spacecraft Center in Jan 1966 and in time became an instructor for the Lunar Module training simulator. I did not train the Apollo 8 crew but I was in Building 4 Christmas Eve at a second floor small remote control room listening to the flight controller’s loop. It was very exciting, after Lunar Orbit Insertion, to hear acquisition of signal and confirmed orbit at approximately 4 am Houston time. I walked over to building 2 (building 1 these days) and got a cup of coffee. On the way back, I looked into a cold, about 35 deg F clear Houston night sky at a waxing crescent winter cold moon for about 15 minutes and thought wow! There are humans in orbit up there.
Making It Happen
Mandated with going to the moon before 1970 you have the following: a launch vehicle that has seventy anomalies on its last unmanned flight; three engines have failed; there are severe pogo problems; and the vehicle has yet to fly with a human crew. You have a spacecraft that has been re-engineered after a terrible disaster. You have a whole suite of on-board and ground software that has never been tested in a full non-simulation mission. You have a large ground tracking network not yet used to working a manned mission at the lunar distance. You have only four months to plan and train for a manned flight no one has ever done before. Four months out, the Pacific fleet was expecting a Christmas break, and no recovery ship might be available. The crew would have no Lunar Module ‘lifeboat’. No human had ever escaped the gravity of the Earth. Facing a terrible array of unknowns, your decision? ‘You’ are George Low, manager of the Apollo Spacecraft Program Office. No hesitation… an orbital flight to the moon! [1, 2, 5]
Problems with achieving a lunar landing mission in 1969 made themselves manifest in the spring of 1968, when the delivery of the Lunar Module slipped. However, troubles with the Saturn V during the Apollo V launch test seemed on the way to solution by late spring. The concept of circumlunar flight goes back to Jules Verne, with the technical aspects laid out by Herman Oberth in 1923. In the 1960’s the flight planning documents for the Apollo program had laid out all the astrodynamics of the trajectory [7]. Problems with the Lunar Module looked as if the first moon landing might be pushed off into 1970.
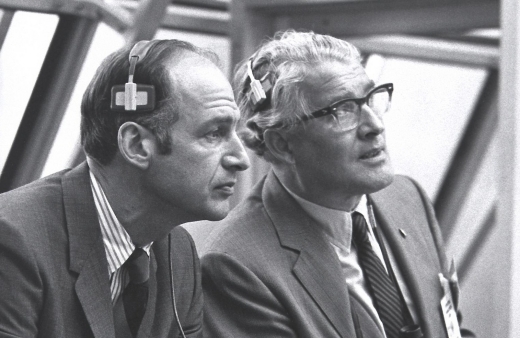
Image: George Low with the iconic Wernher von Braun. Credit: NASA.
Placed against this, the Soviet Union was still actively pursuing a lunar landing, especially the possibility of a circumlunar flight in 1968. In April of 1968, both George Low of the Manned Spacecraft Center (MSC, later JSC) and Director of Flight Operations Chris Kraft started thinking about a lunar flight. By August of 1968, George Low decided the only solution to a lunar landing in 1969 was to fly to the moon before 1968 was out. [1, 2, 5]
The 9th of August 1968 was a very eventful day. Between 8:45 and 10 am, Low, Gilruth (MSC director), Kraft, and director of Flight Crew Operations Donald K. Slayton, after a breathless morning meeting at MSC, set up a meeting at Marshall Space Flight Center with its director Wernher von Braun, Apollo Program Director Samuel C. Phillips and Kennedy Space Flight Center director Kurt Debus at 2:30 pm that same day. At this meeting they finalized a plan to present to senior NASA management that if Apollo 7 were successful, Apollo 8 should not just go circumlunar but into lunar orbit in December of 1968. [1, 2, 5]
On that same August 9th, Slayton called Frank Borman and had him come to Houston from California and asked him if he wanted to go to the moon. He said yes, went back to California and told James Lovell and William Anders. They were enthusiastic. They all came back to Houston to start training. [1, 2, 5]
On August 15th, Deputy Administrator Thomas Paine, Director of the Apollo program, finally got approval from Administrator for Manned Space Flight George Mueller and NASA Administrator James Webb to move ahead with Apollo 8’s moon flight, contingent on the Apollo 7 mission. Therefore, before a manned version of the Command and Service Module had flown, a decision to go to the moon had been made. Planning and preparations for the Apollo 8 mission proceeded toward launch readiness on December 6, 1968. [1, 2, 5] {3], {4}.
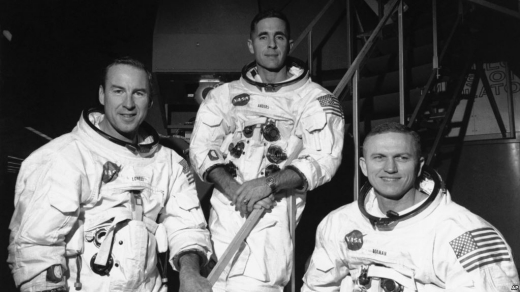
Image: The crew: Jim Lovell, William Anders, and Frank Borman. Credit: NASA.
Critical Factors
On September 9, the crew entered the Command Module Simulator to begin their preparation for the flight. By the time the mission flew, the crew would have spent seven hours training for every actual hour of flight. Although all crew members were trained in all aspects of the mission, it was necessary to specialize. Borman, as commander, was given training on controlling the spacecraft during the re-entry. Lovell was trained on navigating the spacecraft in case communication was lost with the Earth. Anders was placed in charge of checking that the spacecraft was in working order. [1, 2, 5]
September, October and November of 1968 were three months of intense planning , training and work by the Mission Planning & Analysis Division (MPAD) {1}, Flight Crew Operations Directorate (FCOD) and Flight Operations Directorate (FOD). The Manned Spacecraft Center, Marshall Space Flight Center and the Kennedy Space Center had a lot on their plates! [1, 2, 5]
- Marshall had to certify the Saturn V for its first manned spaceflight. (8) {2}
- MPAD had to plan for the first manned vehicle to leave the earth’s gravitational field.
- MOD and FCOD had to plan and train for the first Lunar flight.
- MIT had to prepare for the first manned mission using a computer to perform guidance, navigation and control from the Earth to another celestial body.
- The various Apollo contractors had to prepare every hardware aspect of a Command Module for both transfer in Earth-moon space and orbit operations around the moon.
- The MSC Lunar scientists had to formulate a plan for photographic exploration of the moon from lunar orbit. The science community had to examine and plan for the radiation environment in trans Earth-Lunar space.
- KSC had to plan and train for the first manned Saturn V launch.
- MSC and Apollo contractors had to plan for the first ever hyperbolic re-entry into the Earth’s atmosphere of a manned spacecraft.
That is just some of the problems to be solved!
Apollo 8 was a milestone flight for the Manned Space Flight Network (MSFN), since it was the first test of the network during a mission to the moon. Prior to the mission, concerns were raised regarding small terrestrial errors found in tracking tests that could be magnified to become much larger navigation errors at lunar distances. For assistance in the matter, MSC turned to JPL to look into their navigation system and techniques. JPL personnel, experienced in lunar navigation, proved very helpful as they assisted in locating tracking station location inaccuracies within Houston MCC software. These erroneous values would have manifested themselves as large tracking measurement errors at lunar distances. The tracking station location fixes were implemented less than two days prior to the launch of Apollo 8.
Of special note was Honeysuckle Creek near Canberra in Australia. It had a prime role for many of the first-time critical operations, acquisition of signal after Lunar Orbit Insertion, prime for post-Trans Earth Injection and prime for reentry. [3]
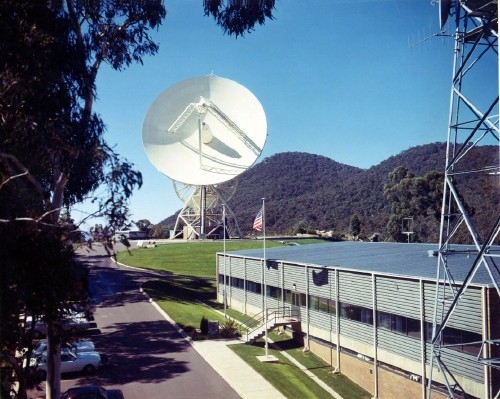
Image: Honeysuckle Creek station, famous for its role in receiving and relaying Neil Armstrong’s image from the lunar surface as he set foot on the moon in 1969, but equally critical in communicating with Apollo 8. Credit: Al Jackson.
Approval and Launch
The success of Apollo 7, flown October 11-22 1968, paved the way. On November 10 and 11th, NASA studied the Apollo 8 mission, approved it and made the public announcement on the 12th. {3}
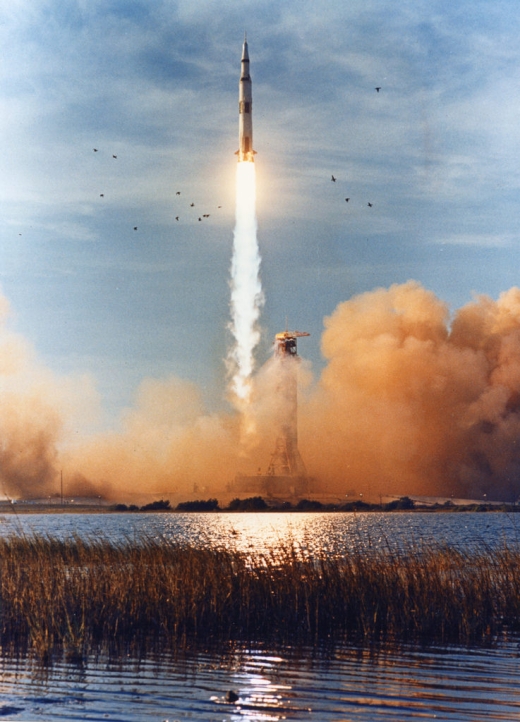
Apollo 8 was launched from KSC Launch Complex 39, Pad A, at 7:51 a.m. EST on December 21 on a Saturn V booster. The S-IC first stage’s engines underperformed by 0.75%, causing the engines to burn for 2.45 seconds longer than planned. Towards the end of the second stage burn, the rocket underwent pogo oscillations that Frank Borman estimated were of the order of 12 Hz. The S-IVB stage was inserted into an earth-parking orbit of 190.6 by 183.2 kilometers above the earth.
Bill Anders later recalled:[4]
“Then the giant first stage ran out of fuel, as it was supposed to. The engines cut off. Small retro rockets fired on that stage just prior to the separation of the stage from the first stage from the second stage. So we went from plus six to minus a tenth G, suddenly, which had the feeling, because of the fluids sloshing in your ears, of being catapulted by — like an old Roman catapult, being catapulted through the instrument panel.
“So, instinctively, I threw my hand up in front of my face, with just a third level brain reaction. Well, about the time I got my hand up here, the second stage cut in at about, you know, a couple of Gs and snapped my hand back into my helmet. And the wrist string around my glove made a gash across the helmet faceplate. And then on we went. Well, I looked at that gash and I thought, ‘Oh, my gosh, I’m going to get kidded for being the rookie on the flight,’ because you know, I threw my hand up. Then I forgot about it.
“Well, after we were in orbit and the rest of the crew took their space suits off and cleaned their helmets, and I had gotten out of my seat and was stowing them, I noticed that both Jim and Frank had a gash across the front of their helmet. So, we were all rookies on that one.”
After post-insertion checkout of spacecraft systems, the S-IVB stage was reignited and burned 5 minutes 9 seconds to place the spacecraft and stage in a trajectory toward the moon – and the Apollo 8 crew became the first men to leave the earth’s gravitational field. [5]
The spacecraft separated from the S-IVB 3 hours 20 minutes after launch and made two separation maneuvers using the SM’s reaction control system. Eleven hours after liftoff, the first midcourse correction increased velocity by 26.4 kilometers per hour. The coast phase was devoted to navigation sightings, two television transmissions, and system checks. The second midcourse correction, about 61 hours into the flight, changed velocity by 1.5 kilometers per hour. [5]
Lovell [4] :
Well, my first sensation, of course, was “It’s not too far from the Earth.” Because when we turned around, we could actually see the Earth start to shrink. Now the highest anybody had ever been, I think, had been either—I think it was Apollo or Gemini XI, up about 800 mi. or something like that and back down again. And all of a sudden, you know, we’re just going down. And it was — it reminds me of looking — driving — in a car looking out the back window, going inside a tunnel, and seeing the tunnel entrance shrink as it gets — as you go farther into the tunnel. And it was quite a — quite a sensation to — to think about. You know, and you had to pinch yourself. “Hey, we’re really going to the moon!” I mean, “You know, this is it!” I was the navigator and it turned out that the navigation equipment was perfect. I mean, it was just — you couldn’t ask for a better piece of navigation equipment.”
The 4-minute 15-second lunar-orbit-insertion maneuver was made 69 hours after launch, placing the spacecraft in an initial lunar orbit of 310.6 by 111.2 kilometers from the moon’s surface – later circularized to 112.4 by 110.6 kilometers. During the lunar coast phase the crew made numerous landing-site and landmark sightings, took lunar photos, and prepared for the later maneuver to enter the trajectory back to the earth. [5]
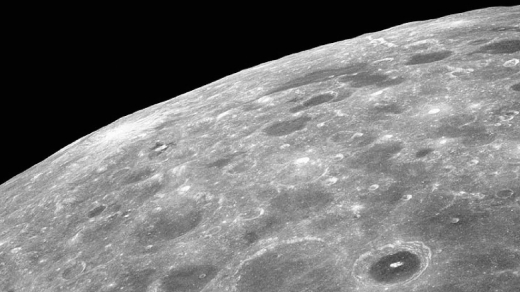
Image: Lunar farside as seen by Apollo 8. Credit: NASA.
Anders [4] :
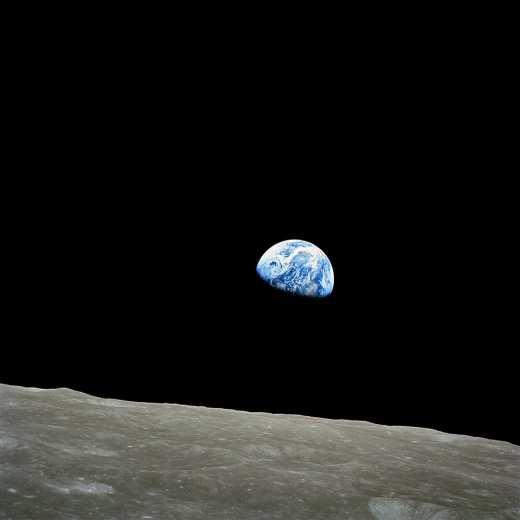
“…That one view is sunk in my head. Then there’s another one I like maybe [and this is] of the first full Earth picture which made it again look very colorful. … [T]o me the significance of this [is that the moon is] about the size of your fist held at arm’s length … you can imagine … [that at a hundred arms’ lengths the Earth is] down to [the size of] a dust mote. [And, a hundred lunar distances in space are really nothing. You haven’t gone anywhere not even to the next planet. So here was this orb looking like a Christmas tree ornament, very fragile, not [an infinite] expanse [of] granite … [and seemingly of] a physical insignificance and yet it was our home…”
Borman [4]:
“Looking back at the Earth on Christmas Eve had a great effect, I think, on all three of us. I can only speak for myself. But it had for me. Because of the wonderment of it and the fact that the Earth looked so lonely in the universe. It’s the only thing with color. All of our emotions were focused back there with our families as well. So that was the most emotional part of the flight for me.”
Chris Kraft:
Anders: “Earthshine is about as expected, Houston.”
Kraft:” I shook my head and wondered if I’d heard right. Earthshine!” [1]
Christmas at the Moon
On the fourth day, Christmas Eve, communications were interrupted as Apollo 8 passed behind the moon, and the astronauts became the first men to see the moon’s far side. Later that day , during the evening hours in the United States, the crew read the first 10 verses of Genesis on television to earth and wished viewers “goodnight, good luck, a Merry Christmas and God bless all of you – all of you on the good earth.” [5]
On Christmas Day, while the spacecraft was completing its 10th revolution of the moon, the service propulsion system engine was fired for three minutes 24 seconds, increasing the velocity by 3,875 km per hr and propelling Apollo 8 back toward the earth, after 20 hours 11 minutes in lunar orbit. More television was sent to earth on the way back and, on the sixth day, the crew prepared for reentry and the SM separated from the CM on schedule. [5]
The Apollo 8 CM made the first manned ‘hot’ reentry at nearly 40,000 km/hr into a corridor only 42 km wide. Parachute deployment and other reentry events were normal. The Apollo 8 CM splashed down in the Pacific, apex down, at 10:51 a.m. EST, December 27 – 147 hours and 42 seconds after liftoff. As planned, helicopters and aircraft hovered over the spacecraft and para-rescue personnel were not deployed until local sunrise, 50 minutes after splashdown. The crew was picked up and reached the recovery ship U.S.S. Yorktown at 12:20 p.m. EST. All mission objectives and detailed test objectives were achieved. [5]
Borman [4]:
“We hit the water with a real bang! I mean it was a big, big bang! And when we hit, we all got inundated with water. I don’t know whether it came in one of the vents or whether it was just moisture that had collected on the environmental control system. … Here were the three of us, having just come back from the moon, we’re floating upside down in very rough seas — to me, rough seas.”
Borman[4]:
“Of course, in consternation to Bill and Jim, I got good and seasick and threw up all over everything at that point.”
Anders [4] :
“Jim and I didn’t give him an inch, you know, we [Naval Academy graduates] pointed out to him and the world, that he was from West Point, what did you expect? But nonetheless, he did his job admirably. But by now the spacecraft was a real mess you know, not just from him but from all of us. You can’t imagine living in something that close; it’s like being in an outhouse and after a while you just don’t care, you know, and without getting into detail… messy. But we didn’t smell anything…”
Christopher Kraft recalled in the Apollo oral history:[4]
“The firsts involved in Apollo 8 almost were unlimited, if you stop to think about it, from an educational point of view, from a theological point of view, from an aesthetic point of view, from an art point of view, from culture, I don’t know, you name it, that event was a milestone in history, which in my mind unless we land someplace else where there are human beings, I don’t think you can match it, from its effect on philosophy if you will, the philosophical aspects of that.”
Addendum: Where will the S-IV go?
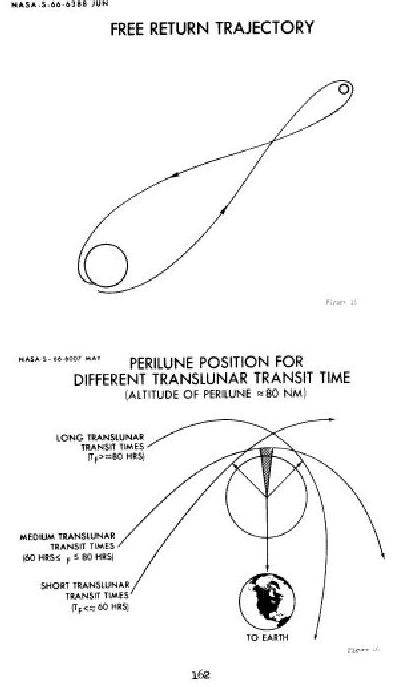
The Saturn V puts Apollo modules and SIVB in an Earth parking orbit. Then Trans Lunar Injection is performed, the Command Module is on a free return trajectory, meaning that if the Service Module engine fails, at any time, a safe return to the earth is possible (if the Service Module power system does not fail as happened with Apollo 13!)
A free-return trajectory is a path that uses the earth’s and the moon’s gravitational forces to shape an orbit around the moon and back to earth again. It’s called a “free-return” because it is, in essence, automatic. With some minor course corrections, a spacecraft will automatically be whipped around the moon, and will be on a trajectory that causes it to intercept the Earth’s. There is enough redundancy to do the final orbit shaping for correct reentry.
Marty Jeness of MPAD told me this story. He was at NASA headquarters in a meeting about free-return. He asked “Where does the S-IVB go?” After all, it also comes back to the Earth! No one had thought about this, but the possibility of a danger from impact on the earth is small It would most likely go into an ocean. To obviate any risk, the S-IVBs for Apollo 8, 10, and 11 made a tweak maneuver that placed them on a slingshot trajectory into solar orbit. (After Apollo 11, the S-IVB impacted the moon for seismic measurements, except that on Apollo 12 the burn misfired and that SIVB went into a solar orbit).
Footnotes
{1} Mission Planning and Analysis Division during Apollo was the first group to tackle the mission plan problems. An unusual group of men and women, they had to solve difficult astrodynamics problems that no one had ever seen before.
{2} Dieter Grau, Chief of Marshall’s Quality and Reliability Operations played a crucial role. It was thought that troubles with the Saturn V that had been uncovered in January of 1968 had been solved. The contractors had ok’d Apollo 8/AS-503. Von Braun sensed Grau’s unease and gave him permission to inspect the Saturn V centimeter by centimeter! After extra weeks of checking and rechecking, Grau and his people in the Quality and Reliability Laboratory finally gave the green light for the launch of Apollo 8.
{3} For the premier launch of a manned Saturn V, NASA prepared a special VIP list. The fortunate individuals on the list received an invitation in attractively engraved and ornate script: “You are cordially invited to attend the departure of the United States Spaceship Apollo VIII on its voyage around the moon departing from Launch Complex 39A, Kennedy Space Center, with the launch window commencing at 7 A.M. on December 21, 1968.” The formal card was signed “The Apollo VIII Crew” and included the notation, “RSVP.”
{4} Before Apollo missions had numbers they had letters. Owen Maynard, one of the engineers who had been designing manned spacecraft for NASA from the beginning, reduced the task of reaching the moon to a series of missions that, one by one, would push Apollo’s capability all the way to the lunar surface. These missions were assigned letters of the alphabet: A, B, C, D “… We kept the flight plans for these in a safe near my office. Since I had a clearance I used to look through these. Apollo 8 was really a ‘D’ mission, which was supposed to be a high Earth orbit mission. One subset was a circumlunar mission. I really did not expect that mission to take place. When Apollo 8 was announced we were surprised to find it had changed into a lunar orbiter mission.
{5} In late September 1968, we knew Apollo 8 was going to happen, but not when. I was surprised watching Walter Cronkite, I think in early October 1968, hearing that 8 was going in December!
References
(1) Kraft, Chris. Flight: My Life in Mission Control. Dutton, 2001
(2) Gene Kranz, Failure Is Not an Option, Simon and Schuster, 2001
(3) Hamish Lindsay, Tracking Apollo to the Moon, Springer, 2001
(4) Oral History Project, Johnson Space Center, 1997 – 2008 (Ongoing)
(5) Apollo 8 Mission Report, MSC-PA-R_69-1, February, 1969.
(6) Robert Zimmerman, Genesis: The Story Of Apollo 8, Basic Books, 1998.
(7) Apollo Lunar Landing Mission Symposium, June 25-27, 1966 Manned Spacecraft Center Houston, Texas
(8) Jeffrey Kluger, Apollo 8: The Thrilling Story of the First Mission to the Moon, Henry Holt and Co., 2017
An earlier version of this article appeared in the newsletter of the Houston Section of the American Institute of Aeronautics and Astronautics , AIAA Houston Horizons Winter 2008.

Looking Ahead

Centauri Dreams posts will unfortunately be sporadic over the next couple of weeks as I attend to some unrelated matters. But I do have several excellent upcoming articles already in the pipeline, including Al Jackson on Apollo 8 at the end of this week. Al, you’ll recall, was involved in Apollo as astronaut trainer on the Lunar Module Simulator, so his thoughts on the program’s extraordinary successes are always a high point.
Image credit: Manchu.
Ashley Baldwin, who knows the ins and outs of space-based astronomy better than anyone I know, will be looking at the key issues involved, with specific reference not only to WFIRST and HabEX but also a mission called EXCEDE, not currently approved but very likely the progenitor of something like it to come.
In early January, Jim Benford will be talking about beamed propulsion in a two-part article that looks to resolve key particle beam issues, with methods worked out by himself and the ingenious Alan Mole. There are all kinds of advantages to particle beaming but doing it without serious beam divergence is a problem we’ve addressed before. A possible solution emerges.
And, of course, we do have Ultima Thule coming up for New Horizons, on New Year’s Eve, no less. Data return including imagery will take some time, so we’ll be talking about the results throughout January. Emily Lakdawalla’s breakdown of the likely schedule gives an overview of the process.
Let me wish you all the best for the holidays. Here’s hoping for spectacular success for New Horizons along the way. Champagne and a working mission in the Kuiper Belt. What a night!
Climate Change and Mass Extinctions: Implications for Exoplanet Life
The right kind of atmosphere may keep a planet habitable even if it crowds the inner region of the habitable zone. But atmospheric evolution involves many things, including the kind of geological activity our own planet has experienced, leading to sudden, deep extinctions. Centauri Dreams regular Alex Tolley today takes a look at a new paper that examines the terrestrial extinction of marine species in the Permian event some 252 million years ago. As we examine exoplanet habitability, it will be good to keep the factors driving such extinctions in mind. Tolley is a lecturer in biology at the University of California and author, with Brian McConnell, of A Design for a Reusable Water-Based Spacecraft Known as the Spacecoach (Springer, 2016). A key question in his essay today: Is our definition of the habitable zone simply too broad?
by Alex Tolley

In the search for life on exoplanets, questions about whether the planet is within the HZ given a plausible atmosphere is based on timescales as a fraction of stellar lifetime on the main sequence. With water may come the emergence of life as we know it, and then the long, slow evolution to multicellular life and possible technological civilization. Planets may initially form too close to a pre-main sequence star to be in the HZ, then enter the HZ, only to leave it again as the star increases in luminosity with age. Earth has experienced about a 30% increase in solar luminosity over its lifetime. The CO2 level needed to maintain a constant surface temperature via the greenhouse effect has had to decline to offset the increased insolation. In 1 to 2 billion years, the further increase in solar luminosity will require the CO2 levels to decline below that needed for photosynthesis, or the Earth’s surface will heat up beyond that sustainable for life.
Yet when considering the environment on a world in the HZ, we should be cognizant that climatic instability may create shocks in the short term that have major impacts on life. Earth has experienced 5 major extinctions based on our reading of the fossil record. The most famous being the dinosaur-killing KT event that ended the Cretaceous and allowed mammals to evolve into the newly vacated ecological niches. However, the largest extinction is known as the Permian extinction, or “Great Dying” when over 95% of marine species became extinct about 252 mya. Unlike the KT event, which was a cosmic throw of the dice, the Permian extinction is believed to be due to massive volcanism of the Siberian Traps that released vast quantities of CO2 into the atmosphere that increased its concentration at least several fold. This caused a rapid temperature rise of 10s of degrees Fahrenheit and was accompanied by ocean acidification.
A new paper by Julian Penn et al suggests that this global temperature change caused the extinction of marine species primarily by metabolic stress and hypoxia.
The core idea is that multicellular, aerobic organisms require critical oxygen pressures to live, with their lowest levels of metabolism during resting, and higher levels for activities, such as swimming or feeding. Sessile organisms may have just a 1.5x increase in active metabolic rate over resting, while energetic organisms like fish may be 5x or more. As temperatures rise, so does the metabolic rate. This, in turn, requires adequate oxygen for respiration. But as the temperatures rise, the dissolved oxygen levels fall, placing additional stress on the animals to maintain their respiration rate. Penn integrated climate models to compute the temperature change and dissolved oxygen partial pressures, with the estimated metabolic rates for the activity of various modern animals to represent Permian species, to determine how ocean habitat temperatures impact the metabolisms of marine genera and probable extinction rates.
Figure 1 shows the relation between metabolic rate and temperature, and the temperature increased metabolic index of ocean habitat by latitude and depth. The polar latitudes and shallower depths show the highest changes in the metabolic index, indicating the most stressed habitats.
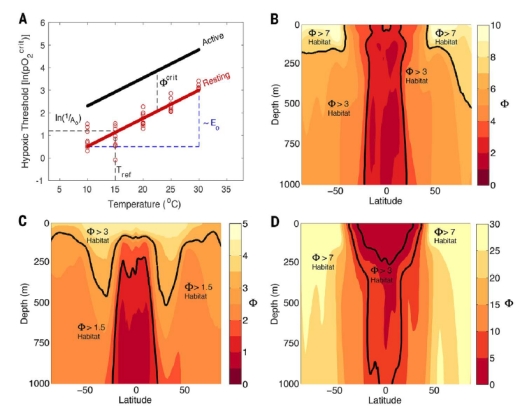
Figure 1. Physiological and ecological traits of the Metabolic Index (F) and its end-Permian distribution. (A) The critical O2 pressure (pO2 crit) needed to sustain resting metabolic rates in laboratory experiments (red circles, Cancer irroratus) vary with temperature with a slope proportional to Eo from a value of 1/Ao at a reference temperature (Tref), as estimated by linear regression when F = 1 (19). Energetic demands for ecological activity increase hypoxic thresholds by a factor Fcrit above the resting state, a value estimated from the Metabolic Index at a species’ observed habitat range limit. (B) Zonal mean distribution of F in the Permian simulation for ecophysiotypes with average 1/Ao and Eo (~4.5 kPa and 0.4 eV, respectively). (C and D) Variations in F for an ecophysiotype with weak (C) and strong (D) temperature sensitivities (Eo = 0 eV and 1.0 eV, respectively), both with 1/Ao ~ 4.5 kPa. Example values of Fcrit (black lines) outline different distributions of available aerobic habitat for a given combination of 1/Ao and Eo. Credit: Justin Penn and Curtis Deutsch, University of Washington.
Figure 2 shows the spatial changes in ocean temperature and oxygen concentrations. Oceanic temperatures rise, particularly towards the poles, and with it a reduction in dissolved oxygen. As expected the greatest rises in temperature are at the shallower depths, particularly with the highly productive continental shelves. Oxygen level declines are most widely seen at all depths at the poles, but far less so in the tropics.
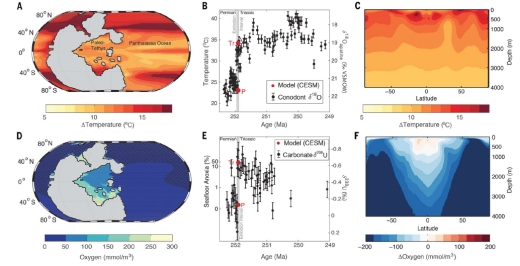
Figure 2. Permian/Triassic ocean temperature and O2. (A) Map of near surface (0 to 70 m) ocean warming across the Permian/Triassic (P/Tr) transition simulated in the Community Earth System Model. The region in gray represents the supercontinent Pangaea. (B) Simulated near surface ocean temperatures (red circles) in the eastern Paleo-Tethys (5°S to 20°N) and reconstructed from conodont d18Oapatite measurements (black circles) (4). The time scale of the d18Oapatite data (circles) has been shifted by 700,000 years to align it with d18Oapatite calibrated by U-Pb zircon dates (open triangles) (1), which also define the extinction interval (gray band). Error bars are 1°C. (C) Simulated zonal mean ocean warming (°C) across the P/Tr transition. (D) Map of seafloor oxygen levels in the Triassic simulation. Hatching indicates anoxic regions (O2 < 5 mmol/m3). (E) Simulated seafloor anoxic fraction ƒanox (red circles). Simulated values are used to drive a published one-box ocean model of the ocean’s uranium cycle (8) and are compared to d238U isotope measurements of marine carbonates formed in the Paleo-Tethys (black circles). Error bars are 0.1‰. (F) Same as in (C) but for simulated changes in O2 concentrations (mmol/m3). Credit: Justin Penn and Curtis Deutsch, University of Washington.
The authors conclude:
The correspondence between the simulated and observed geographic patterns of selectivity strongly implicates aerobic habitat loss, driven by rapid warming, as a main proximate cause of the end-Permian extinction.
However, while the temperature is the proximate cause, the authors note that other factors are also involved.
“In our simulations, net primary productivity is reduced by ~40% globally, with strongest declines in the low latitudes, where essential nutrient supply to phytoplankton is most curtailed.”
Ocean acidification is also a potential factor, as we may be seeing today. Acidification will be higher at the poles, creating a habitat barrier for species that require more calcification.
Figure 3 is a schematic of the model, fitting the probable extinction rates to the fossil record. Their model predicts a latitudinal impact of warming that is also suggested by the fossil record. Their explanation for this spatial pattern is that tropical organisms are preadapted to warmer temperatures and lower O2 levels. As the oceans warm, these organisms migrate polewards to cooler waters. However, polar species have nowhere to migrate to, and therefore have a higher rate of extinction.
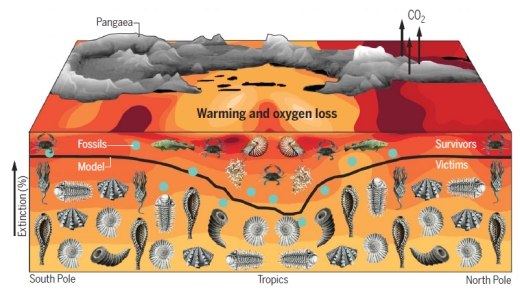
Figure 3. An illustration depicting the percentage of marine animals that went extinct at the end of the Permian era by latitude, from the model (black line) and from the fossil record (blue dots). The color of the water shows the temperature change, with red representing the most severe warming and yellow less warming. At the top is the supercontinent Pangaea, with massive volcanic eruptions emitting carbon dioxide. The images below the line represent some of the 96 percent of marine species that died during the event. Credit: Justin Penn and Curtis Deutsch, University of Washington.
As our current analog of the Permian climate change impacts the oceans, we are already seeing warm water species appearing in the cold North Atlantic, far north of their historic ranges. We can also expect species like the Arctic ice fish that has no red blood cells due to the high O2 concentrations in polar waters to become extinct as polar waters continue to warm.
What about the extinction of terrestrial life? 70% of terrestrial faunal species went extinct. The attractiveness of this theory is that it also applies to terrestrial life, although the oxygen depletion was not a factor. What is clear as well is that the CO2 increase heated the planet, overwhelming any cooling from dust blown up into the atmosphere, as experienced with the 2 year global cooling after Mt. Pinatubo erupted.
Had the Earth been closer to our sun, or temperatures risen further due to greater volcanic activity, the extinctions might conceivably have been 100% for all multicellular genera. Earth life might have been pushed back to primarily archaea and bacteria. The atmosphere might have reverted back to its Archaean state. If photosynthesizers were still present, how long would it take for aerobic multicellular life to evolve again?
The major extinctions have implications for life on exoplanets. Worlds closer to the inner edge of the HZ may be supportive of life if the atmosphere stays stable. However, as we have seen with the example of the Permian extinction, geologic processes can upset that balance, potentially making a world uninhabitable for a period, forcing any life to be restricted to simpler forms. How frequently could such events cause mass, even total extinctions, on other worlds, despite long-term conditions being favorable for life? It is perhaps worth considering whether the inner edge HZ limits should be made more conservative to allow for such events.
The paper is Penn et al., “Temperature-dependent hypoxia explains biogeography and severity of end-Permian marine mass extinction” Science Vol. 362, Issue 6419 (7 December 2018). Abstract (Full Text behind paywall).
Early Returns from Bennu
The science return from OSIRIS-REx has been surprisingly swift as the spacecraft returns data on near-Earth asteroid 101955 Bennu. We’re aided here by the timing, as early results are being discussed at the ongoing conference of the American Geophysical Union (AGU) in Washington, DC. The imagery we’ve received of Bennu’s surface has scientists buzzing. Thus Humberto Campins (University of Central Florida) a member of the OSIRIS-REx Science Team, who notes the comparison between what we see now and the Arecibo radar imagery in the late 1990s:
“The images are spectacular and spot on, what we expected thanks to predictions made with the instrumentation at the Arecibo Observatory in the late 90s and early 2000s. We will spend a year and a half mapping Bennu and have to wait until mid 2020 [when] we collect the sample, but it is pretty amazing to actually see it now. Christmas came early.”
The Arecibo work began shortly after the asteroid’s discovery in 1999, when both the Puerto Rico observatory and the Goldstone planetary radar system were used to examine Bennu. A second Arecibo investigation led to a shape model and pole orientation study published in 2013 by the OSIRIS-REx science team chief, Michael Nolan (University of Arizona). Arecibo’s radar data also firmed up Bennu’s size and rotation period, while even detecting a boulder on the asteroid’s surface. The 2013 model predicted Bennu’s shape, rotation rate, inclination and diameter, all of which have been confirmed by the OSIRIS-REx OCAMS camera suite.
“Radar observations don’t give us any information about colors or brightness of the object, so it is really interesting to see the asteroid up close through the eyes of OSIRIS-REx,” Nolan said. “As we are getting more details, we are figuring out where the craters and boulders are, and we were very pleasantly surprised that virtually every little bump we saw in our radar image back then is actually really there.”
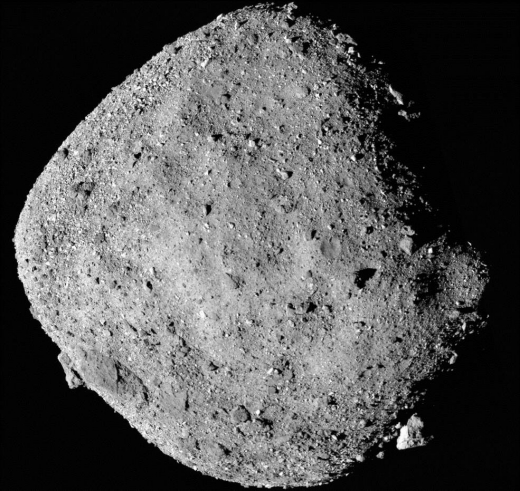
Image: This mosaic image of asteroid Bennu is composed of 12 PolyCam images collected on Dec. 2 by the OSIRIS-REx spacecraft from a range of 24 km (15 miles). Credit: NASA/Goddard/University of Arizona.
But science observations were, of course, occurring long before the arrival at Bennu. During the approach phase, which began in August, OSIRIS-REx turned its two spectrometers, the OSIRIS-REx Visible and Infrared Spectrometer (OVIRS) and the OSIRIS-REx Thermal Emission Spectrometer (OTES), on the target. We learn that the resulting data show the presence of oxygen and hydrogen atoms bonded together as hydroxyls, which researchers believe exist across the entire asteroid in water-bearing clay minerals.
To be sure, Bennu is too small an object to have had water on its surface at any point in its evolution, but at some point, its rocky components must have interacted with water. The implication is that liquid water was present on Bennu’s parent body, a much larger asteroid. What a find for the OSIRIS-REx team, given that the mission was designed to study the volatiles and organics found in the early Solar System through the lens of this asteroid. Rolling the dice on a sample mission here is paying off, as by 2023 we’ll have surface materials in a lab right here on Earth..
“This finding may provide an important link between what we think happened in space with asteroids like Bennu and what we see in the meteorites that scientists study in the lab,” said Ellen Howell, senior research scientist at the UA’s Lunar and Planetary Laboratory, or LPL, and a member of the mission’s spectral analysis group. “It is very exciting to see these hydrated minerals distributed across Bennu’s surface, because it suggests they are an intrinsic part of Bennu’s composition, not just sprinkled on its surface by an impactor.”
The number and variety of boulders on the surface is said to be unexpected, as is the size of the large boulder near the asteroid’s south pole. Observations from the ground pegged its height at 10 meters, but OSIRIS-REx is showing us through OCAMS imagery that it is more like 50 meters tall, with a width of approximately 55 meters. Given the scarcity of smooth surfaces, the search for a suitable sample site may be a complicated one.
With orbital insertion planned for December 31, we have an interesting conjunction for deep space aficionados, as New Horizons will be making its flyby of Kuiper Belt object Ultima Thule later that evening. After the OSIRIS-REx orbit is established, the spacecraft will remain in orbit until February, when it will begin another series of survey flybys. The upcoming orbit, by the way, is interesting in its own right. It will take the spacecraft between 1.4 and 2 kilometers from Bennu’s center, making this the tightest orbit of a space object by any spacecraft.
But before the orbit can be established, mission controllers are working on Bennu’s mass, a vital issue given its effects on the gravitational field of the object. The current preliminary survey passes within 7 kilometers of the north pole, equator and south pole, retrieving data that will also be useful in understanding the internal structure and composition of the asteroid. This mission has plenty of work ahead, but the early results could not be more interesting.
Voyager 2 Makes It Through
Voyager 2 has now gone interstellar, making it not only NASA’s single longest-running mission but one of only two spacecraft that have crossed over from the heliosphere to true interstellar space, what scientists call the Local Interstellar Medium (LISM). On that note, it’s interesting to put the Solar System in context. Depending on how you define the term, the Solar System takes in a great deal of interstellar space. Many astronomers put its outer edge at the outer Oort Cloud, perhaps 100,000 AU away, and both Voyagers have yet to reach the inner Oort.
At an estimated 1,000 AU, the inner boundary of the Oort Cloud is where the vast cometary cloud around our star becomes apparent, housing in its entirety trillions of comets and extending about 40 percent of the way to the Alpha Centauri stars. The Voyagers will keep going, of course, and will reach the inner Oort in perhaps 300 years, though without working instrumentation. The steady diminishment of power from the crafts’ radioisotope thermal generators (about 4 watts per year) means we have ten years or less to power instruments.
What a splendid run this has been, and we’re still performing good science.
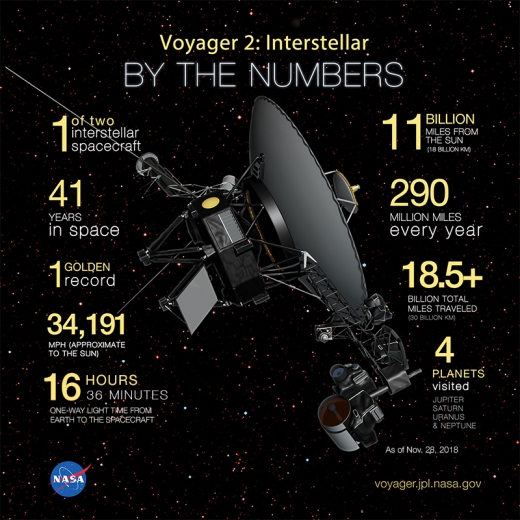
Image: Artist’s concept of Voyager 2 with 9 facts listed around it. Credit: NASA.
Speaking of instruments, it is the robust health of one in particular that has made the Voyager 2 crossover so apparent. Both Voyagers carry a Plasma Science Experiment (PLS), but the one on Voyager 1 stopped working in 1980. But Voyager 2’s PLS told the tale: Measuring the plasma outflow from the Sun — commonly called the solar wind — Voyager 2 could chart the speed, density, temperature, pressure and flux of the plasma. The steep decline in the speed of the solar wind particles on November 5, and the fact that since that time, the PLS has seen no solar wind flow around Voyager 2, leaves little doubt the craft has departed the heliosphere.
“Working on Voyager makes me feel like an explorer, because everything we’re seeing is new,” said John Richardson, principal investigator for the PLS instrument and a principal research scientist at the Massachusetts Institute of Technology in Cambridge. “Even though Voyager 1 crossed the heliopause in 2012, it did so at a different place and a different time, and without the PLS data. So we’re still seeing things that no one has seen before.”
Cameras aboard the Voyagers were turned off long ago to conserve power, but beside the PLS, three other instruments continue to function: The low-energy charged particle instrument, the magnetometer, and the cosmic ray subsystem. All of these show data consistent with Voyager 2’s having crossed the heliopause. We can now compare results from both Voyagers as we investigate the interstellar medium, learning how the heliosphere itself interacts with the plasma flow JPL calls the ‘interstellar wind.’
Image: Animated gif showing the plasma data. Credit: NASA/JPL-Caltech.
Bear in mind we also have the Interstellar Boundary Explorer (IBEX) in operation, making observations of the boundary from within the heliosphere. Also in the cards is the Interstellar Mapping and Acceleration Probe (IMAP), which will operate at the L1 Lagrange point about 1.5 million kilometers from Earth to monitor solar wind interactions at the edge of the heliopause by collecting and analyzing particles that make it through the boundary from the LISM. The latter mission is scheduled for launch in 2024, and I’ll have more to say about it soon.
Long-haul missions to deep space demand payloads that can function for decades and perhaps centuries, a fact that has concerned mission designers contemplating component lifetimes in this harsh environment. It’s heartening to think of the two Voyagers, then, for both were built to last five years, enough to make their flybys of Jupiter and Saturn. Uploaded programming helped with the Uranus and Neptune flybys, the latter occurring 12 years after launch. Who would have thought that 41 years into the mission we would still be taking data?
We’re learning numerous lessons about spacecraft longevity by their example, and can contemplate future missions specifically built for interstellar medium exploration. The challenges of getting to, say, the 550 AU gravity lens of the Sun are immense, but if spacecraft built so long ago can leave the heliosphere, next-generation missions are well within our capability. What kind of interstellar precursor will follow the Voyagers and New Horizons out toward the Oort?
The When and Where of Asteroid 101955 Bennu
You wouldn’t think the Yarkovsky effect would have any real significance on a half-kilometer wide pile of rubble like the asteroid 101955 Bennu. With a currently estimated mass somewhere between 60 and 80 billion kilograms, Bennu seems unlikely to receive much of a nudge from differences in heat on the object’s surface. But the people who specialize in these things say otherwise. Sunlight warms one side of the asteroid while the other experiences the cold of space. Rotation keeps the dark side radiating heat, accounting for a tiny thrust.
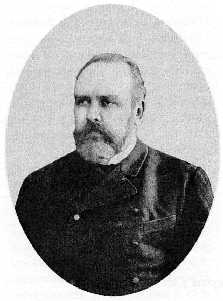
We call it the Yarkovsky effect after Ivan Osipovich Yarkovsky, a Polish engineer who came up with it in 1901, though if we want to give credit across the board, we might refer to the Yarkovsky-O’Keefe-Radzievskii-Paddack (YORP) effect. Here we honor, in addition to Yarkovsky, an American scientist, a Russian astronomer and a NASA aerospace engineer, all of whom played a role in our understanding of the phenomenon as it relates to asteroids.
Image: Ivan Osipovich Yarkovsky (1844-1902). Credit: Wikimedia Commons.
The YORP effect turns up in interesting places, such as the near-Earth asteroid 2000 PH5, whose rotation rate has been spun up about as fast as any asteroid known, an effect traced over a four-year period by a team led by Stephen Lowry at Queens University Belfast (citation below). When it comes to Bennu, where we now have OSIRIS-REx in active investigation, researchers have calculated that the effect has shifted its orbit about 284 meters per year toward the Sun since 1999. Remember that Bennu originally came our way from the main asteroid belt, a movement inward that was presumably assisted by the same YORP effect.
On a scale of billions of years, then, YORP can create serious movement within the Solar System. But one reason for having OSIRIS-REx on the case is that we need to learn more about how such effects work so we can make better predictions about the future position of asteroids. Will a given asteroid present problems, with a potential trajectory that could intersect with the Earth? The calculation is by no means easy. With YORP alone, so much depends on the nature of the object, and how it absorbs and releases heat. We’d better learn as much as we can about such objects, a need that plays a role in asteroid missions that also investigate the evolution of the Solar System and the ancient debris that circulates among the planets.
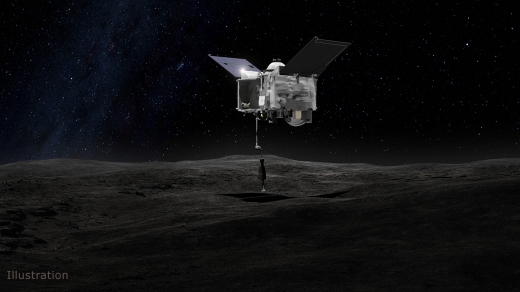
Image: This artist’s concept shows the Origins Spectral Interpretation Resource Identification Security – Regolith Explorer (OSIRIS-REx) spacecraft contacting the asteroid Bennu with the Touch-And-Go Sample Arm Mechanism or TAGSAM. The mission aims to return a sample of Bennu’s surface coating to Earth for study as well as return detailed information about the asteroid and its trajectory. Credit: NASA’s Goddard Space Flight Center.
If the YORP effect makes our orbital calculations problematic, so too do the gravitational forces imparted by the Sun, nearby planets and other asteroids. As this JPL news release points out, astronomers can predict the exact dates of the next four passes Bennu will make near our planet (defined here as within 7.5 million kilometers, or .05 AU). The years in question are 2054, 2060, 2080 and 2135. But things get increasingly tricky as we look further out. For each time Bennu comes near the Earth, our planet gives its trajectory another slight twitch.
If you’re trying to figure out where Bennu will be in coming decades, then, you have to take into account the increasingly fuzzy effects that occur with each pass by the Earth, so that by 2060, when another such passage is predicted, we can only say that the asteroid will pass the Earth at about twice the distance from Earth to the Moon. But it could pass any point in a 30 kilometer window of space. Keep magnifying these numbers with future orbits and you can see why firm predictions become so difficult.
By 2080, according to calculations performed by Steven Chesley at the Center for Near-Earth Object Studies (CNEOS) at JPL, the best window we can derive for Bennu’s passage is 14,000 kilometers wide. Switch ahead to 2135, a time when Bennu’s orbit is thought to take it closer than the Moon, and the flyby window reaches 160,000 kilometers. This is, by the way, a projection for the single near-Earth asteroid for which we have the best orbital assessment in our database.
We’ve been studying Bennu through optical, infrared and radio telescopes every six years since its discovery in 1999 to measure factors like shape, rotation rate and trajectory. Given all that, CNEOS can say that looking ahead over the next century, the asteroid has a 99.963 percent change of missing the Earth. That’s heartening, but it’s clear that tightening up our numbers will help. And we can do a lot by way of studying how the YORP effect nudges the asteroid.
“There are a lot of factors that might affect the predictability of Bennu’s trajectory in the future, but most of them are relatively small,” says William Bottke, an asteroid expert at the Southwest Research Institute in Boulder, Colorado, and a participating scientist on the OSIRIS-REx mission. “The one that’s most sizeable is Yarkvovsky.”
Optical images from OSIRIS-REx will help determine Bennu’s precise location and its exact orbital path as of now, giving us a read on how its trajectory is changing with time. With the spacecraft tracking Bennu over a two-year period, the variance from the projected trajectory will help to determine the size of the YORP effect’s changes. We’ll also learn a great deal about the amount of solar heat radiating from the asteroid from what type of surfaces, which will help us refine the YORP numbers, a huge help in tightening the trajectories of other asteroids.
OSIRIS-REx should eventually be able to tell us how craters and boulders change photon scattering and momentum transfer. Says Chesley:
“We know surface roughness is going to affect the Yarkovsky effect; we have models. But the models are speculative. No one has been able to test them.”
Refining models through on the spot observation is a major reason for doing OSIRIS-REx. When the mission is over, the team believes our projections of Bennu’s orbit will be 60 times better than what we now have. If only Ivan Osipovich Yarkovsky could be here to see this.
The paper on 2005 PH5 is Lowry et al., “Direct Detection of the Asteroidal YORP Effect,” Science Vol. 316, Issue 5822 (13 April 2007), pp. 272-274 (abstract).
Follow with RSS or E-Mail
