Centauri Dreams
Imagining and Planning Interstellar Exploration
Seven Planets around TRAPPIST-1
The red dwarf known as TRAPPIST-1 could not have produced a more interesting scenario. Today we learn that the star, some 40 light years out in the constellation Aquarius, hosts seven planets, all of which turn out to be comparable to the Earth in terms of size. Moreover, these worlds were discovered through the transit method, meaning we have mass and radius information for all of them. Today’s report in Nature tells us that three of the planets lie in the habitable zone, and thus could have liquid water on their surfaces.
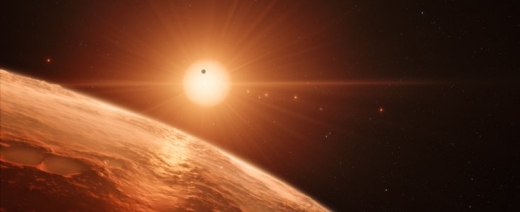
TRAPPIST-1 b, c, d, e, f, g and h are the worlds in question, and all but TRAPPIST-1h appear to be rocky in composition, based on density measurements drawn from the mass and radius information. Drawing on existing climate models, the innermost planets b, c and d are probably too hot to allow liquid water to exist, while h may be too distant and cold. But the European Southern Observatory is reporting that TRAPPIST-1e, f and g orbit within the star’s habitable zone, leaving us with the possibility of oceans and the potential for life.
Caution compels me to home in on the word ‘potential’ in the above sentence, and also to remind readers that we’ve seen many planets described as being in the habitable zone for which later study made a much less compelling case. Thus I appreciate lead author Michaël Gillon (STAR Institute, University of Liège), whose enthusiasm is evident when he says “This is an amazing planetary system — not only because we have found so many planets, but because they are all surprisingly similar in size to the Earth!” But I also look forward to the close analysis the community gives habitable zone issues and what it will reveal. In particular, let’s see what Andrew LePage comes up with in his own Habitable Zone Reality Check.
My own reservation about habitability: The age of TRAPPIST-1, thought to be in the range of 500 million years, points to a young dwarf of the kind given to flare activity. Here I note a paper from Peter Wheatley (University of Warwick), with Michaël Gillon as one of the co-authors. In “Strong XUV irradiation of the Earth-sized exoplanets orbiting the ultracool dwarf TRAPPIST-1,” Wheatley and team present XMM-Newton X-ray observations of TRAPPIST-1, finding ‘a relatively strong and variable coronal X-ray source with an X-ray luminosity similar to that of the quiet Sun.” A snip from the paper:
The TRAPPIST-1 system presents a fabulous opportunity to study the atmospheres of Earth-sized planets as well as the complex and uncertain mechanisms controlling planet habitability. Whatever the mechanisms at play, it is clear that these planets are subject to X-ray and EUV irradiation that is many-times higher than experienced by the present-day Earth and that is sufficient to significantly alter their primary and any secondary atmospheres. The high energy fluxes presented here are vital inputs to atmospheric studies of the TRAPPIST-1 planets.
None of that is to downplay the significance of this discovery, but simply to put it in context (it also should remind us how many factors come into play in the word ‘habitability’). Even so, with seven planets in a compact system around this dim red star, we certainly have some interesting real estate to work with. And we’ll certainly have plenty to investigate in a system with multiple transits. TRAPPIST-1 has about 8 percent the mass of the Sun. To be in the habitable zone here, a planet needs to be close to the parent star — indeed, the planetary orbits around TRAPPIST-1 are not much larger than what we find among Jupiter’s larger moons, and much smaller than the orbit of Mercury in our own system.
That means that transits are deep, as the planets are close to a very small star. Gillon and co-author Amaury Triaud (University of Cambridge) worked with space and ground instruments to make this detection, which follows up their original discovery of three Earth-sized planets there, announced in 2016. The TRAPPIST-South telescope at La Silla produced data complemented by the Very Large Telescope (Paranal) and the Spitzer Space Telescope and several other ground based instruments in the course of these observations.
The news conference on the TRAPPIST-1 findings goes online just as I publish this, and I’m sure we’ll have more to say about this fascinating system in short order.

Exoplanet News Conference
You’ll want to see the news conference scheduled by NASA at 1300 EST (1800 UTC) today, an exoplanet finding of considerable interest to Centauri Dreams readers (I’ll have more on this later in the day). The event will air live on NASA Television and the agency’s website. Links available here.
Briefing participants:
* Thomas Zurbuchen, associate administrator of the Science Mission Directorate at NASA Headquarters in Washington
* Michael Gillon, astronomer at the University of Liege in Belgium
* Sean Carey, manager of NASA’s Spitzer Science Center at Caltech/IPAC, Pasadena, California
* Nikole Lewis, astronomer at the Space Telescope Science Institute in Baltimore
* Sara Seager, professor of planetary science and physics at Massachusetts Institute of Technology, Cambridge
A Reddit AMA (Ask Me Anything) about exoplanets will be held following the briefing at 1500 EST (2000 UTC) with scientists available to answer questions in English and Spanish.
Interstellar Conference News
Registration is now open for the 2017 Tennessee Valley Interstellar Workshop, which will be held in Huntsville, AL on October 4-6. The title for this year’s conference is “Step By Step: Building a Ladder to the Stars.” The registration page is here, and if you’re thinking of attending, I recommend registering right away, as spaces filled up swiftly the last time around. This year’s TVIW will take place in partnership with the Tau Zero Foundation as well as Starship Century, which has already produced two successful symposia of its own.
Despite its regional name, the Tennessee Valley Interstellar Workshop has become a well received forum for interstellar discussions on a global scale, with speakers and workshop participants well known to Centauri Dreams readers. Registration at this year’s event costs $175, with discounts available for students. Pre-symposium seminars for an additional fee are to be held on Tuesday October 3. This year’s topics are Conflict in Space; Laser Propulsion: An Introduction to Laser Propulsion and Assessment of Relevant Current Technologies; and Human Life in Space – Separating Reality from Wishful Thinking.
I’ve been pleased to attend all of the previous symposia except the last one, which I had to miss because of an untimely bout of the flu. The recent call for papers jogged me into getting my registration in early, as I don’t want to miss two in a row. The text below is taken directly from the submissions page on the TVIW site:
——-
TVIW 2017 Call for Papers, Workshop Tracks, and Posters: The Tennessee Valley Interstellar Workshop (TVIW), in collaboration with Starship Century and Tau Zero Foundation, hereby invites participation in its 2017 Symposium to be held from Wednesday, October 4 through Friday, October 6, 2017, in Huntsville, Alabama. Our Program Committee is seeking proposals for Plenary Papers/Talks, Working Tracks, and Sagan Meetings as well as other content such as posters.
Plenary Papers include traditional papers, lectures, and presentations that will be selected from submitted abstracts. See Appendix 1 for details and abstract submission guidelines.
Working Tracks are collaborative, small group discussions around a set of interdisciplinary questions on an interstellar subject. See Appendix 2 for details and abstract submission guidelines.
Sagan Meetings are new for TVIW 2017. Carl Sagan famously employed this format for his 1971 conference at the Byurakan Observatory in old Soviet Armenia, which dealt with the Drake Equation. Each Sagan Meeting will invite five speakers to give a short presentation staking out a position on a particular question. These speakers will then form a panel to engage in a lively discussion with the audience on that topic.
Invited Talks are presentations that contain significant results or describe major activities in the field and will be solicited by sponsoring organizations or the conference organizers.
Discussion Groups are for those not participating in the working tracks or Sagan Meetings and offer opportunities for free form discussion of subjects of mutual interest to attendees. They are unstructured and no specific output is expected although it is hoped that these groups might generate teams and/or topics that would lead to future Working Tracks and possible collaborative efforts in the interstellar field. Coffee, pen, and paper will be provided. An expanded list of possible topics will be available each day of the Symposium and anyone wishing to propose a topic is free to do so. Contact David Fields (fieldsde@tviw.us) to suggest topics.
Other Content includes, but is not limited to, posters, displays of art or models, demonstrations, panel discussions, interviews, or public outreach events. Please refer to Appendix 1 for more information and the abstract submission guidelines.
——-
Full information on formats and other structural matters can be found on the Submissions page. If you’re wondering about ‘working tracks,’ TVIW has used these in the past to engage up to four parallel tracks on issues of interstellar import, such as mission targets, propulsion systems, life support and the human factors needed for interstellar exploration. Each working track will be allocated two-hour blocks each day. Proposals for working tracks are still open, with the letter of intent deadline coming up on March 3, and deadline for complete proposals on March 31. TVIW hopes to have four to six working tracks in the 2017 symposium.

I notice that Andrew Siemion (UC-Berkeley), who serves as director of the UC Berkeley Center for the Search for Extraterrestrial Intelligence (SETI) will be speaking in Huntsville. Siemion is also one of the leaders of the Breakthrough Listen Initiative, which under the aegis of the Breakthrough Prize Foundation is conducting the most sensitive search yet for signs of extraterrestrial technology. At TVIW 2017, Siemion will be discussing “The Search for Ourselves Among the Stars,” a look at the past, present and future of SETI activities.
Foundations of Interstellar Studies Workshop
I’ve also recently heard from Kelvin Long, who heads up the Initiative for Interstellar Studies, about a workshop to be held at City Tech, CUNY in New York from June 13-15. The group’s goal is “facilitating real progress on existing problems related to interstellar studies.” This year’s session is to have a propulsion focus, but according to the workshop’s web page, the focus will change with successive meetings as issues arise and concepts change.

Sponsored by the i4IS and the Center for Theoretical Physics (CTP) at City Tech, the workshop is intended as a small gathering with informal conversations and social interactions designed to promote discussion. The deadline for ‘extended abstracts’ is March 15, though this can be extended to the 25th. Early bird registration begins April 1, with regular registration beginning April 17. The advantage of early registration is a discounted fee for attendance ($200 per person); the fee goes up to $250 once regular registration begins.
Here is the group’s overview of the event:
——-
At the start of this new millennium we are faced with one of the greatest challenges of our age Can we cross the vast distances of space to visit other worlds around other stars? At the end of the last century the idea of interstellar travel was considered one of science fiction. In recent times that has changed and interstellar flight has received much interest. This is particularly since the discovery of many planets outside of our Solar System around other stars. Indeed, we now know that an Earth sizes mass planet orbits one of our closest stars, Proxima b. In addition, national space agencies and private commercial industry are beginning to turn their attention to the planets and beyond. It is time to start considering the bold interstellar journey and how we might accomplish it. Yet, this challenge presents many difficult problems to solve and who better to address them than the global physics community.
The Institute For Interstellar Studies (I4IS) and the Center for Theoretical Physics (CTP) at City Tech have partnered to bring together some of the best minds in the fields of physics to address some of the fundamental problems associated with becoming an interstellar capable civilisation.
——-
The first day of the workshop is devoted to ‘energetic reaction engines,’ i.e., engines that involve the ejection of matter or energy rearward from the vehicle to generate thrust. This could be electric, plasma, nuclear thermal, fission, fission-fragment, fusion, antimatter catalyzed fusion, antimatter. Day 2 focuses on sails and beamed energy via photons or particle beams, covering laser sails, microwave sails, particle beamers, stellar wind pushers. Day 3 is given over to breakthrough propulsion topics, “an area of technology development that seeks to explore and develop a deeper understanding of the nature of space-time, gravitation, inertial frames, quantum vacuum, and other fundamental physical phenomena.”
Harold ‘Sonny’ White is to chair day 3 of the workshop, with Kelvin Long taking day 1 and CUNY’s Roman Kezerashvili taking day 2. White’s presence will give the opportunity for those interested in his latest EmDrive work to learn and ask questions. I haven’t seen him since we ate cheeseburgers sitting around the swimming pool at the Dallas Starship Congress meeting some years back. I’ve enjoyed being at several conferences with Kelvin, and remember Roman Kezerashvili from the Aosta conference in Italy where I first met him. He’s a rigorous scholar and an engaging conversationalist. It will be interesting to see how this crew finalizes the lineup of presentations for the upcoming event.
Submissions to the workshop are open, and those accepted are to appear in the Journal of the British Interplanetary Society. On the nature of submissions, the group says this:
All submissions should be attempted solutions of existing problems, or at least a strong discussion on the pathway towards a solution. This is a working meeting and audience participation and discussion should be expected in any results. The rule for the workshop is “no solution, no presentation”. Some spaces will be reserved for ‘special observer status’ participation.
For further information on submission format, see Foundations of Interstellar Studies
Workshop at City Tech, CUNY.
Martian Civilization
What kind of civilization might eventually emerge on Mars? Colonies of various kinds have been examined in science fiction for decades, but as we close in on the possibility of actual human arrival on the planet, perhaps in the 2030s, we can wonder how living on a different world will change the people who eventually choose to call it home. The prolific Nick Nielsen likes to take the long view, arguing in the essay below that while there are contrasting definitions of civilization itself, we may yet learn through experiment and experience how a ‘central project’ emerging from local conditions may define the future of colonies on other worlds. Human history offers guidance, but it may be that a successful Martian colony will see its position as a gateway to the exploration of the Solar System. You can follow Nick on his Grand Strategy: The View from Oregon site, as well as his Grand Strategy Annex.
by J. N. Nielsen
Settling Mars

Suppose that one or several planned large-scale missions to Mars come to fruition over the next few decades. Perhaps the first mission or missions are temporary scientific visits that endure a few weeks or months and then Mars is left vacant again. Even if it is only a handful of individuals temporarily on Mars for a few weeks or a few month of exploration, the camaraderie unique to these early Mars missions will be the first intimation of a distinctively Martian social milieu.
Beyond the transient exploration of a scientific mission, the vision of several Mars mission planners includes settlement, and these plans, if realized, will mean that eventually there will be large numbers of human beings living and working on Mars. We may see a patchwork of multiple settlements and multiple temporary scientific missions, existing side-by-side, each pursuing their own ends in their own ways. Some of the early explorers may chose to return and to remain, their lives having been touched and irrevocably changed by their initial encounter with the Red Planet.
In the case of an ongoing human presence, the numbers of human settlers will grow, eventually also they will become self-supporting and self-sustaining. Whether or not they formally declare their independence, they will be independent for all practical purposes. Given these eventualities, at some point we will need to recognize that an independent and distinctive Martian civilization exists. At what point in its development would we recognize a Martian civilization? What will be the character of this civilization?
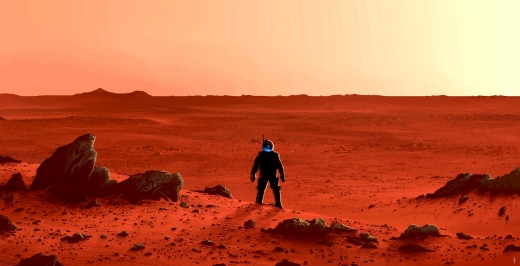
Image: A lone explorer on Mars by Italian digital artist Alberto Vangelista.
A Martian Perspective
In the classic science fiction film Forbidden Planet there is a striking scene early in the film in which two characters discuss the color of the sky, and one says, “I think a man could get used to this and grow to love it.” Will Martian settlers get used to the red skies of Mars and grow to love it?
Whether or not they love the red skies of the Red Planet, these red skies will be a fact of life on Mars no less than the red sands under foot. These Martian facts of life will collectively shape a distinctive Martian perspective, and a Martian civilization will grow out of a uniquely and distinctively Martian perspective. In What will it be like to be a Martian? I have already discussed that there will be something that it is like to be a Martian (borrowing from Thomas Nagel’s famous formulation that there is something that it is like to be a bat [1]), and in The Martian Standpoint (and Addendum on the Martian Standpoint) I discussed the emergence of a distinctively Martian perspective.
This perspective will be marked by properties in common with terrestrial civilization (such as being human) as well as properties not shared with terrestrial civilization (living life under a red sky, being able to pick out Earth in the night sky, having to wear a pressure suit outside, and so on). Most of that which is in common with terrestrial life will pass unnoticed, but the differences will be prominent in the minds of Martian settlers precisely because the differences will stand out against the background of unnoticed similarity.
Mars itself, its gravity, its weather, its seasons, the length of its day and coolness of the sun in the sky, as well as the adaptations that the settlers will have to make in order to live on Mars, will become selection pressures that will shape the social life of these communities. An individual human being who experiences what it is like to be a Martian, and who, as a consequence of living on Mars, has a Martian perspective, will be an individual participating in a community, all of whom are experiencing what it is like to be a Martian and to have a Martian perspective. Pride in being first on Mars will be mixed with equal parts homesickness, and, just so, every aspect of human moral psychology will find itself tested by the tension between old and new. From this dialectic will emerge an outlook unique to Mars, the Martian perspective, and this Martian perspective will inform all aspects of social life, from the most intimate introspection to the most public debates on what kind of society the Martians should build for themselves.
As the Martians go about building the economic infrastructure of Martian civilization, an intellectual superstructure will come into being in parallel with the built environment, and infrastructure and superstructure will be inseparably joined by the central project of Martian civilization, which at first will simply be the attempt to build a self-sustaining and self-supporting human presence on Mars. [2] What form the central project of Martian civilization will take after this initial goal is achieved cannot now be known. Martian society will be sufficiently small that it could be comprehensively motivated and unified by a central project, and the population of Mars will be sufficiently self-selected for scientific acumen and practical ability that whatever central project naturally grows out of the combined exertions of this population is likely to be as distinctive as the self-selected conquistadors who came to South America and the self-selected Puritans who came to North America.
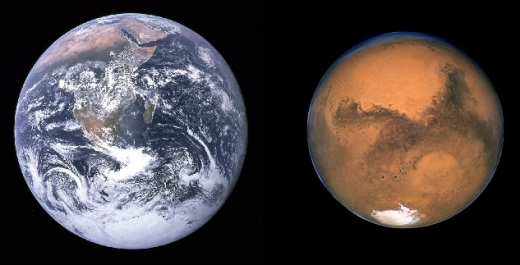
A Tale of Two Planets: Terrestrial Civilization and Martian Civilization
Civilization on Earth has already passed through many stages of development, and it is at least arguable that at least some terrestrial civilizations have reached maturity, but a nascent civilization on Mars, while an heir to these mature traditions of terrestrial civilization, would be an entirely novel enterprise. The Martian civilization will be a new civilization, and as a new civilization it will begin its social development at its inception; it will not be a mature civilization of long-established institutions, but a tentative experimentation in institution building and in ways of life possible on Mars.
When a civilization originates in a given historical epoch, that historical epoch is expressed in that civilization, so that the civilization of classical antiquity expressed the world of the ancient Mediterranean Basin and the civilization of medieval Islam expressed the world of seventh century Arabia and the civilization of the industrial revolution expressed Enlightenment era northern Europe. Martian civilization, coming into being in the twenty-first civilization, would emerge from a radically different social context than any of these previous civilizations, and so it would express a radically different world than civilizations of the past. Martian civilization, then, could be a new civilization in more than one sense. It would also be a civilization de novo.

Image: Workshop of Filippe Maëcht and Hans Taye. Constantine Directing the Building of Constantinople. 1623-1625. Wool, silk, gold and silver. 484 × 480 cm (190.6 × 189 in). Philadelphia.
De novo civilization
For quite some time I have been planning to write about the possibility of what I call de novo civilization, i.e., civilizations that are newly constituted, but are distinct from those civilizations with which civilization began on Earth. The earliest civilizations in the world—the West Asian Cluster (Anatolia, Mesopotamia, Egypt, etc.), Mesoamerican, Peruvian, Chinese, and Indian civilizations, at a minimum—were all de novo civilizations, originating as something entirely new in the history of the planet. These original civilizations might be called “founder” civilizations, as they were the founders of all civilizations to subsequently follow.
Descended from these “founder” civilizations were a greater or lesser number of subsequent civilizations—depending upon the principles we adopt to individuate and therefore count civilizations—that were derived from the founder civilizations through descent with modification, through idea diffusion, through allopatric speciation, and so on. By identifying de novo civilizations as new civilizations distinct from this small, finite class of founder civilizations, I am suggesting that a new civilization can come into being through a new foundation (or a re-foundation) of some existing civilization. What particularly interests me most are those civilizations that “suddenly” come into being as the result of some relatively rapid historical change. Martian civilization would be such a de novo civilization arising from a new foundation.
The best example I can offer of de novo civilization is that of Byzantium. The Byzantine Empire is typically identified as becoming a distinct entity sometime between Constantine’s foundation of Constantinople (on the site of the earlier Greek city of Byzantium) in 330 and the reign of Justinian during the sixth century AD. Constantine spared no expense in furnishing his new Christian capital city, endowing it with art and sculpture essentially looted from other much older cities. An urban proletariat was even imported to populate the new metropolis. Eventually Greek speaking, and eventually Orthodox in its Christianity, Constantinople and the distinctive Byzantine civilization over which the city presided had inherited the traditions of Roman civilization, and as the city grew in size and influence there was no “breakdown” of trade or communication that isolated the region. When the last legal emperor of the western Roman Empire, Romulus Augustulus, surrendered control of Rome to the barbarian king Odoacer, the imperial insignia were sent to Constantinople for safekeeping. Thus Byzantium, still in touch with its parent civilization, nevertheless speciated and became its own distinctive civilization, different from Rome even while continuing to self-identify as Roman.
So it will be, I think, with Martian civilization, which will become its own distinctive civilization even while continuing to self-identify with essential elements of terrestrial civilization. The selection pressures upon terrestrial and Martian civilization will be so markedly different that the speciation of Martian civilization from its parent terrestrial civilization is nearly inevitable, although there will be ongoing commerce, communication, and conflict between Earth and Mars. Martian civilization will emerge as a de novo civilization even in the absence of a rupture between Earth and Mars; the transfer of some portion of terrestrial civilization to a human population on Mars will be sufficient for a new foundation of civilization, even if this is not what is intended.

Image: Prehistorian V. Gordon Childe at Skara Brae, Orkney.
V. Gordon Childe’s “urban revolution” on Mars
One of the most influential accounts of the origin of civilization is that of V. Gordon Childe, and, ironically, it was not explicitly cast as an account of civilization, but rather of the “urban revolution,” i.e., the origin of cities. [3] There is a vast literature on Childe’s “urban revolution” and it has become a commonplace among archaeologists, especially those archaeologists formulating theories about the origins of civilization, to employ Childe’s ten criteria for the urban revolution as a definition of civilization: something is a civilization if it possesses most of the items on Childe’s list. [4] Subsequent prehistorians have tinkered and tampered with Childe’s model, but for the most part it remains intact and continues to influence archaeological thought about civilization even today.
While Childe does not himself assert that the properties he identifies as characterizing the urban revolution constitute a definition of civilization, he may as well have said so, as this is the lesson that has been taken from the paper. In so far as “urban revolution” implies the revolutionary appearance of many cities, the lesson is justified. A rough characterization of civilization could be a network of cities actively engaged in cooperation and conflict with each other. [5] We see this pattern clearly in Mesopotamia, in Mesoamerica, in the Indus Valley, and will probably find it wherever civilization independently emerges.
Following this example, when there are a network of settlements on Mars actively engaged in cooperation and conflict with each other (as in the suggestion above that Mars may be a patchwork of settlements both temporary and permanent), we could at that point identify a Martian civilization. As Martian civilization grows, it will unify itself as a planetary civilization, all of which evolves under the uniform physical selection pressures of the planet, just as terrestrial civilization has evolved under the uniform selection pressures of Earth. On Mars, communication between regions of the planet will be nearly instantaneous, as is communication on Earth today, and the immediate neighborhood of Mars, its satellites and space stations, will also be a part of this instantaneous communications network. Mars will have its own internet, which will presumably be updated on a regular basis, much like a backup system where Mars and Earth each back up the other. Martian social media will be dominated by “Martian issues” just as terrestrial social media will be dominated by terrestrial issues.
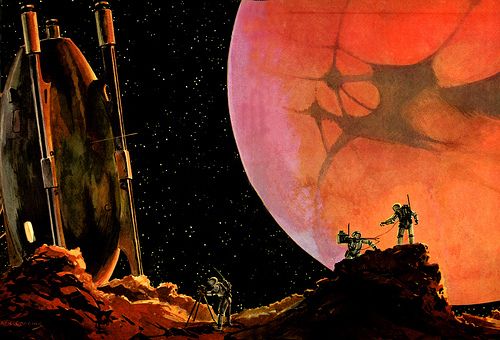
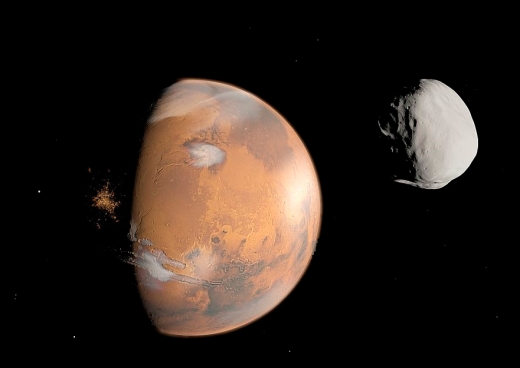
Image: Mars may come to be the origin of a spacefaring civilization. (Mars from the Moon Phobos by Jack Coggins, 1951).
Two planetary civilizations projected onto the cosmos
A planet is a natural unit for civilization, which I have expressed elsewhere by saying that planetary civilization is the natural teleology of civilization. [6] Beyond the scope of a planetary civilization communication will experience relativistic delays that become longer the more distant the parties to the communication. There will be communication between Mars and Earth, of course, but of a stilted and somewhat awkward variety, as there will be trade, probably a trickle of luxury goods (rather than staples) as once slowly moved along the Silk Road tenuously connecting the ancient east to the ancient west. Communication and commerce, however, will underscore rather than unify the natural planetary units of Earth and Mars. Exactly what is communicated and what is traded (as well as what is not communicated and what is not traded) will define a system of meanings and values, and these systems will be different on Earth and Mars. [7]
We can always formulate a more comprehensive conception of civilization that includes both terrestrial civilization and Martian civilization—presumably this more comprehensive conception will be “human civilization” as this conception will of necessity be based on those properties shared in common between terrestrial and Martian civilization—much as we can today speak of a planetary civilization that encompasses the many regional civilizations that have grown together as human transportation, communication, and commerce networks have come to integrate the planet entire. Perhaps this more comprehensive conception of civilization could also be called a de novo civilization. With planetary civilization converging on totality, the next stage of emergence in large-scale social organization will be the interaction of these distinct planetary civilizations—the civilizations of Earth, Mars, the moon, and elsewhere, including clusters of artificial habitats.
The expanding scope of large-scale social organization, from a network of cities involved in cooperation and conflict to a network of planets involved in cooperation and conflict and eventually a network of planetary systems engaged in cooperation and conflict, define stages in the development of a cosmological civilization. The civilization that we may yet build within our own solar system will be a model in miniature of an interstellar civilization in which it is a network of planetary systems engaged in cooperation and conflict that defines large-scale social organization. In this context, the different between terrestrial and Martian civilization may become significant.
In the settlement of the New World it is interesting to note the difference between those regions settled directly by European peoples and those regions settled not from the Old World, but from earlier settlements. Thus while New England was settled by Puritans from England, the Carolinas were settled by Caribbean planters. [8] Sugar cane was such a lucrative crop that every scrap of available ground on the Caribbean islands was planted in sugar cane plantations, but these plantations in turn needed to be supplied with foodstuffs and building materials, and so the Carolinas were settled in order to produce the sustenance and material goods required by the export-oriented monoculture of sugar plantations in the Caribbean. [9] The cultural differences between these regions persists to the present day, and is likely to continue to persist into the foreseeable future.
It would be reasonable to expect that a similar pattern will reveal itself in the settlement of the solar system, with some colonies being established directly from Earth, while other colonies may be established by Martian and Lunar settlements, once these latter have reached a sufficient state of development that they can mount outward colonization efforts themselves. [10] In this way, the characteristic differences between terrestrial and Martian civilization will be perpetuated throughout the solar system, and perhaps even throughout the galaxy, and may persist long after any rivalry between Earth and Mars is politically relevant.
But will it ultimately be terrestrial or Martian civilization that leaves the greatest imprint on the universe? The fact that Martians will have already made the leap from Earth to Mars, representing the first spacefaring diaspora, and the likely disproportionate scientific and technological knowledge and expertise in the Martian population to come, will predispose Martians to a central project for their civilization based on spacefaring. Once the Martians have assured their survival and independence, the solar system will be at their doorstep. Mars is the perfect base for a spacefaring civilization, with the lower gravity making the construction of a space elevator easier than on Earth, and being positioned close to the asteroid belt Thus even if a scientific and spacefaring civiization does not fully emerge on Earth, social conditions on Mars may be more favorable to such a development.
——————————————————-
Notes
[1] Thomas Nagel, “What is it like to be a bat?” The Philosophical Review, LXXXIII, 4 (October 1974): 435-50.
[2] I sometimes define civilization as an economic infrastructure joined to an intellectual superstructure by a central project. I regard this formulation as tentative. Mass societies may be too large and too diverse to be defined by a single central project, so a mass society may have several central projects, but no single, dominant project—or it may have no central project at all. Prior to the advent of mass society, regional civilizations (not yet having converged on planetary scale) were almost always strongly marked by a central project, which almost always was soteriological or eschatological in nature.
[3] V. Gordon Childe, “The Urban Revolution,” The Town Planning Review, Vol. 21, No. 1 (Apr., 1950), pp. 3-17. (Careful observers of the Indiana Jones films will notice that the archaeologist protagonist of the films cites V. Gordon Childe.)
[4] In brief, Childe’s list includes, 1) extent and density of settlements, 2) division of labor, i.e., craft specialization, 3) surplus value transferred to social elites (which might also be called “capital accumulation”), 4) monumental architecture, 5) social stratification, 6) writing, 7) science, 8) art, 9) trade, and 10) prioritizing residence over kinship. I briefly touched on Childe’s conception of civilization in terms of the urban revolution in my talk at the 2015 Starship Congress, “What kinds of civilizations build starships?” in which I also gave an exposition of my understanding of economic infrastructure and intellectual superstructure (cf. note [2]).
[5] Above in note [2] I said that I sometimes define civilization as an economic infrastructure joined to an intellectual superstructure by a central project; I also sometimes define a civilization as a network of cities bound by relationships of cooperation and conflict. I regard all of these formulations as tentative; the definitive definition of civilization has yet to be formulated. The definition of civilization in terms of a network of cities is obviously a practical characterization that could be established by means of archaeology; a definition of civilization as a central project linking infrastructure and superstructure is much more abstract, and for the same reason it is much more likely to be adaptable to unforeseen developments in the future.
[6] The assertion that planetary civilization is the natural teleology of civilization may be true for only one historical stage in the development of civilization (I explored this idea in Counterfactual Suboptimal Civilizations of Planetary Endemism and Addendum on Civilizational Optimality). It could be argued that the natural extent of a civilization grows over time, so that the earliest manifestation is a city-state with a surrounding region, then an empire, then a regional civilization, then a planetary civilization, then a system-wide civilization, and so on.
[7] These systems of meanings and values constitute part of the intellectual superstructure.
[8] Similarly, in South America Chile was settled for purposes of supply rather than monoculture export.
[9] New England also came to rely on export-oriented monoculture, but of tobacco rather than sugar, especially the “tobacco colonies” of the Chesapeake Bay region. While Caribbean islands were not large enough both to produce sugar for export and to produce their own food, there was sufficient land in New England for both export and staple crops.
[10] It is to be expected that most if not all of the earliest settlement enterprises will be financial failures, if historical analogy holds: “Many early colonial adventures—like Cartier’s voyages, the Panfilo de Narvaez expedition, and Raleigh’s Guiana and Roanoke projects—were characterized by gigantic losses. By the end of the 1620s every single English colonial company had failed both financially and organizationally, and every single early French trading company had been dissolved; by 1674, the Dutch West Indies Company had gone bankrupt for the first of two times.” (A Companion to the Literatures of Colonial America, edited by Susan Castillo and Ivy Schweitzer, p. 64)
Deep Space Projects for Citizen Scientists
I’m always interested in ways readers can dig directly into data from our telescopes, and this morning I can point to two. I’ll begin with the Lick Carnegie Exoplanet Survey, which has just released 60,949 precision Doppler velocities for 1,624 stars. The data draw on observations using HIRES (the High Resolution Echelle Spectrometer) on the Keck 1 telescope on Mauna Kea (Hawaii). As exoplanet hunter Greg Laughlin (UC-Santa Cruz) explains on his systemic site, the data contain hundreds of possibly planetary signals.
If you’d like to dig into this material, which includes hints of a super-Earth around the fourth closest star to the Sun (Lalande 21185), I’ll remind you of Stefano Meschiari’s Systemic Console, developed with Laughlin as a way of exploring exoplanetary data. The latest version completely reworks the older Console and provides the tools needed to study the Lick Carnegie material. Versions of this open source software are available here, and a visit to the Earthbound Planet Search website will yield links to the Lick Carnegie data release.
As to the stars under examination, they are primarily the nearest and brightest F, G, K and M-class stars visible from Mauna Kea. All are within 100 parsecs (326 light years), though some include a relatively short range of data, while others offer a deeper dataset. Accompanying the data release is an upcoming paper, “The LCES HIRES/Keck Precision Radial Velocity Exoplanet Survey,” slated for publication at The Astronomical Journal (preprint available).
Discussing the data release on systemic, Laughlin noted an interesting fact as he placed the Lick Carnegie work in context:
…as the breakthroughs rolled in, the Keck I Telescope was gradually accumulating Doppler measurements of hundreds of nearby Sun-like stars with HD designations and magnitudes measured in the sevens and eights. This data is as important for what it shows (scores of planets) as for what it doesn’t show (a profusion of planets with Jupiter-like masses and orbits). There are several reasons why our Solar System is unusual, and Jupiter is one of them.
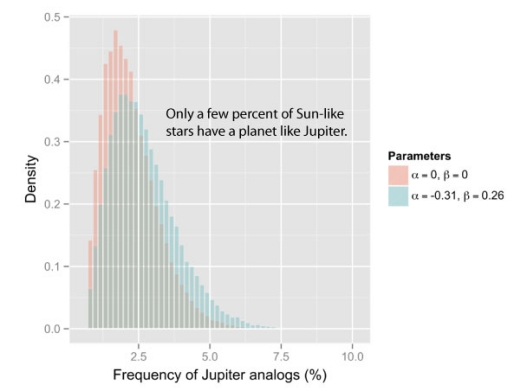
Image: From Greg’s systemic discussion, drawing on Rowan 2016.
Just how unique is our Solar System? It’s an intriguing question to keep in mind, and one that provides additional motivation for digging into the data in classrooms and in the home. Laughlin has spoken before about ‘democratizing’ the search for planets, which is all about making not just the data but the software tools available for trying out possible planetary orbits that would explain what we’re seeing. Expect much more as this dataset is examined.
Backyard Worlds: Planet 9
NASA’s Wide-field Infrared Survey Explorer (WISE) mission captured a lot of attention in these pages as it scanned the entire sky between 2010 and 2011. Although its primary mission ended in 2011, WISE was reactivated in 2013 with the charter of finding near-Earth objects that could be potentially hazardous. The latter mission was named the Near-Earth Object Wide-field Infrared Survey Explorer (NEOWISE).
A lot of us were keeping an eye on M-class dwarfs and, especially, brown dwarfs, wondering whether a dim object might not exist much closer to the Earth than the Alpha Centauri stars. If WISE had found something like this, it would have given us a much closer target for an interstellar mission, but no such target has yet emerged. Even so, we’re not quite through with the WISE data. There may be brown dwarfs waiting to be found therein, not to mention distant objects in our own Solar System including, if it exists, the as yet undetected Planet Nine.
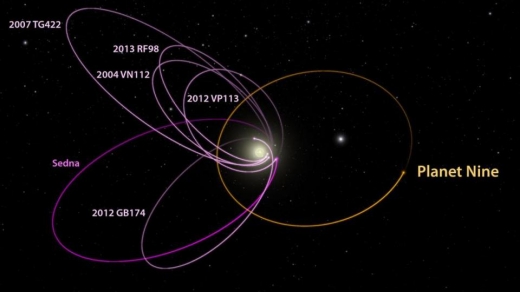
Image: This diagram shows the orbits of several Kuiper Belt objects that were used to infer the existence of Planet 9. If it exists, Planet 9 may reveal itself in WISE infrared images. Credit: ASU.
Making such finds now comes down to looking for moving objects in WISE images, an effort in which human eyes have a role to play, because computers can trip over image artifacts in crowded parts of the sky. Thus we get Backyard Worlds: Planet 9, a new website that puts computer users — citizen scientists — to work doing what Clyde Tombaugh did in the search for Pluto, studying imagery to pick out the moving object while disregarding the artifacts.
The site works through ‘flipbooks’ — brief animations that show the changes in small parts of the sky over time. Objects spotted by sharp-eyed observers will be prioritized for future investigation. The image below illustrates the process with a real WISE discovery.
Image: Previously known brown dwarf WISE 0855-0714 is seen here in this Backyard World flipbook as a moving orange dot at upper left. Citizen scientists will be asked to inspect images just like this to search for new objects in the solar neighborhood. Credit: NASA.
Working in the infrared, WISE produced data on nearly 750 million individual sources in the sky, working at infrared wavelengths that could reveal objects emitting at low temperatures. In other words, there’s plenty of work here for those patient enough to study these images. “There are just over four light-years between Neptune and Proxima Centauri, the nearest star, and much of this vast territory is unexplored,” said the lead researcher for Backyard Worlds: Planet 9, Marc Kuchner, an astrophysicist at NASA’s Goddard Space Flight Center.
Bringing the human ability to spot movement against a fixed background, and bringing in large numbers of volunteers to work the project, allows all of us to get involved with these ongoing investigations. Can we find what the computers have missed amidst the virtual noise?
Stellar Pulsations Induced by Planet
It’s no surprise that planets can affect the stars they orbit. We’ve used that fact for several decades now, relying on radial velocity studies that showed the movement of a star toward us and then away again as it was tugged on by the planet under investigation. But now we’re hearing about another kind of planetary effect, one whose future uses may be intriguing. We’re seeing a star’s brightness change in evident synchrony with a planetary orbit.
The star is some 370 light years away from the Earth. The planet in question is HAT-P-2b, a ‘hot Jupiter’ in a highly elliptical orbit that makes its closest approach to the star every 5.6 days. The planet, discovered by the automated HATNet project (Hungarian Automated Telescope Network), is about 8 times Jupiter’s mass. The temperature changes its orbit should induce in its atmosphere led indirectly to the brightness discovery, for researchers led by Julien de Wit (MIT) wanted to learn about the circulation of energy in the planet’s atmosphere, causing them to turn to the Spitzer infrared telescope for data.
The dataset de Wit and colleagues consulted contained some 350 hours of observation between July of 2011 and November of 2015. The planet’s passage close to and then behind the star as seen from Earth was the key window of interest, as changes to the star’s brightness can reveal how much energy it is delivering to the planet. The method has been used with success before on planets like HD 149026b, likewise studied with Spitzer data.
What the researchers found was a bit of a surprise. When the planet passed behind the star, oscillations in the star’s light with a period of 87 minutes became visible. The signals were tiny — de Wit compares them to the sound of a mosquito next to a jet engine — but they demanded attention because their period was an exact multiple of the planet’s orbital frequency.
The paper recounts the team’s exhaustive analysis of possible effects in the Spitzer instrument itself, and explains why the only conclusion they could reach was that this was a stellar, not an instrumental, effect. Bear in mind that while HAT-P-2b is a massive planet, it is dwarfed by its host star, which is more than 100 times more massive. A pulsation effect at this scale seems unusual, showing how much we have to learn about planet/star interactions.
“This is really exciting because, if our interpretations are correct, it tells us that planets can have a significant impact on physical phenomena operating in their host-stars,” says co-author Victoria Antoci, a postdoc at Aarhus University in Denmark. “In other words, the star ‘knows’ about its planet and reacts to its presence.”
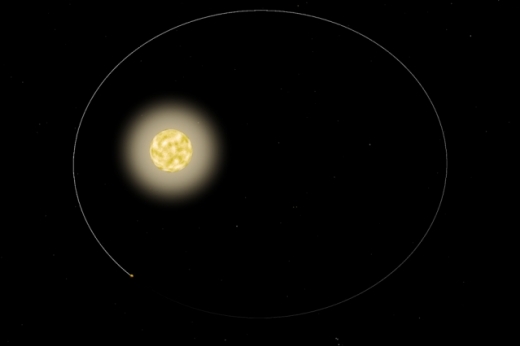
Image: For the first time, astronomers have observed a star pulsing in response to its orbiting planet. The star, HAT-P-2, pictured, tracks its star in a highly eccentric orbit, flying extremely close to and around the star, then hurtling far out before eventually circling back around. Credit: NASA (edited by MIT News).
The find is interesting indeed, but fraught with issues. For one thing, pulsations on a star are far from unusual. Could what de Wit and company observed simply be a natural phenomenon unrelated to the planet? The answer is almost certainly no, because the oscillations are only observed during the planetary occultations, and the correspondence between the pulsations and the planet’s orbital frequency implies a strong connection between the two.
Pulsations caused by tidal effects have been seen before in binary star systems (these are known as ‘heartbeat’ stars), and the researchers turn to tidal effects as an explanation. From the paper:
The photometric observations also show no sign of orbit-to-orbit variability nor of orbital evolution but reveals high-frequency low-amplitude stellar pulsations that correspond to harmonics of the planet’s orbital frequency, supporting their tidal origin.
But the explanation only goes so far:
Current stellar models are however unable to reproduce these pulsations. HAT-P-2’s RV [radial velocity] measurements exhibit a high level of jitter and support the orbital evolution of HAT-P- 2 b inconsistent with the ultra-precise eclipse times. The inability of current stellar models to reproduce the observed pulsations and the exotic behavior of HAT-P-2’s RV indicate that additional observations and theoretical developments are required to understand the processes at play in this system.
We have, in other words, to gather more data, presumably through future missions like TESS, PLATO and CHEOPS, to understand these intriguing interactions. The star’s pulsations are the tiniest variations of light from any source that Spitzer has ever measured. But on a broader front, are we seeing the development of a new kind of exoplanet discovery tool, one that would work regardless of the orbital inclination of an undetected planet? The paper speculates on the possibility, noting that such detections could flag stars that we would then want to submit to examination with direct imaging and radial velocity techniques.
The paper is De Wit, “Planet-Induced Stellar Pulsations in HAT-P-2’s Eccentric System,” Astrophysical Journal Letters 14 February 2017 (preprint).
Follow with RSS or E-Mail
