Centauri Dreams
Imagining and Planning Interstellar Exploration
Wolf 1061 Unlikely to Host Habitable Worlds
A key way to learn more about a given exoplanet is to home in on the properties of its star. So argue Stephen Kane (San Francisco State University) and colleagues in a new paper slated for the Astrophysical Journal. The star in question is Wolf 1061 (V2306 Ophiuchi), an M-class red dwarf some 13.8 light years away in the constellation Ophiuchus. In December of 2015, Australian astronomers announced the discovery of three planets around the star.
Drawn out of data from the HARPS spectrograph at La Silla, the planets are all super-Earths, their radial velocity data supplemented with eight years of photometry from the All Sky Automated Survey. All three seem likely to be rocky planets, but firming this up would take transits, which the discovery team at the University of New South Wales estimated might occur, with a likelihood of about 14 percent for the inner world, dropping to 3% for the outer.
Kane and team investigate the transit question in light of the fact that that two recent papers have produced sharply different orbital periods for the outermost planet here, though both find planet c near or within the habitable zone, which itself depends on the star’s luminosity and effective temperature. Both the recent papers see reasonably high transit possibilities, but Kane’s work rules out transits of the two inner worlds, leaving open a possibility for the outer.
The researchers have used observations from the Center for High Angular Resolution Astronomy (CHARA) interferometric array at Mount Wilson Observatory near Los Angeles. From this emerges a precise stellar radius measurement (0.3207±0.0088 R?), from which the team has calculated the star’s effective temperature and luminosity. The photometry data reveal a stellar rotation period of 89.3±1.8 days. The work has useful implications for upcoming space-based exoplanet studies. As the paper notes:
The assessment of host star properties is a critical component of exoplanetary studies, at least for the realm of indirect detections through which exoplanet discoveries thus far have predominantly occurred. This situation will remain true for the coming years during which the transit method will primarily be used from space missions such as the Transiting Exoplanet Survey Satellite (TESS), the CHaracterising ExOPlanet Satellite (CHEOPS), and the PLAnetary Transits and Oscillations of stars (PLATO) mission. Of particular interest are the radius and effective temperature of the stars since the radius impacts the interpretation of observed transit events and the combination of radius and temperature is used to calculate the extent of the HZ.
And indeed, it is through this painstaking analysis of stellar properties that the researchers have been able to calculate habitable zone boundaries for Wolf 1061 of 0.09–0.23 AU. Have a look at the paper’s Figure 8, which shows the Wolf 1061 system as diagrammed from above.
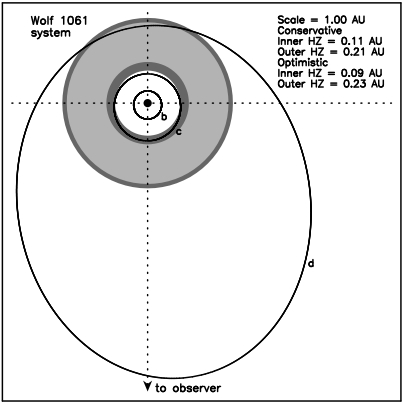
Image: Figure 8 from the paper shows the orbits of the planets overlaid on the habitable zone. The scale here is 1.0 AU to the side, with the ‘conservative’ habitable zone shown as light gray, and the more optimistic extension shown in dark gray. Credit: Kane et al.
Notice the outer planet (d), which passes briefly through the habitable zone at closest approach to the star before widening further out in its eccentric orbit. Indeed, only 6 percent of the orbital period takes place within the habitable zone. Planet c spends 61 percent of its orbit within the habitable zone, but only within the optimistic assumptions for the HZ. Taking into account the recent orbital solutions for this system, both inner worlds are problematic:
…planet c is quite similar to the case of Kepler-69 c, which was proposed to be a strong super-Venus candidate by Kane et al. (2013). Indeed, both of the inner two planets, terrestrial in nature according to the results of both Wright et al. (2016) and Astudillo-Defru et al. (2016b), lie within the Venus Zone of the host star (Kane et al. 2014) and are thus possible runaway greenhouse candidates.
Measuring stellar parameters unlocks the boundaries of the habitable zone, allowing the researchers to study the planetary orbits and weigh the chances for liquid water on the surface. The results hardly favor the Wolf 1061 system as a promising candidate for life.
We find that, although the eccentric solution for planet c allows it to enter the optimistic HZ, the two inner planets are consistent with possible super-Venus planets (Kane et al. 2013, 2014). Long-term stability analysis shows that the system is stable in the current configuration, and that the eccentricity of the two inner planets frequently reduces to zero, at which times the orbit of planet c is entirely interior to the optimistic HZ. We thus conclude that the system is unlikely to host planets with surface liquid water.
The paper is Kane et al., “Characterization of the Wolf 1061 Planetary System,” accepted for publication at the Astrophysical Journal (preprint).

PROCYON: An Overview of Cometary Water
The Japanese PROCYON spacecraft (Proximate Object Close flyby with Optical Navigation) has just given us an interesting case of repurposing a scientific instrument, not to mention drawing value out of a mission whose initial plans had gone awry. Launched together with JAXA’s Hayabusa 2 probe in late December of 2014, PROCYON was to have flown by asteroid 2000 DP107 in 2016, but a malfunctioning ion thruster put an end to that plan.
Fortunately, PROCYON carried LAICA, a telescope that was put to use to study the Earth’s geocorona (the outermost layer of the atmosphere). Developed at Japan’s Rikkyo University, LAICA observes emissions from hydrogen atoms, a useful capability when turned to comet studies, as a team of researchers has now done with comet 67P/Churyumov-Gerasimenko. Water being the most abundant cometary ice, its release rate helps map activity on the comet and offers clues to how water was incorporated into comets in the early Solar System.
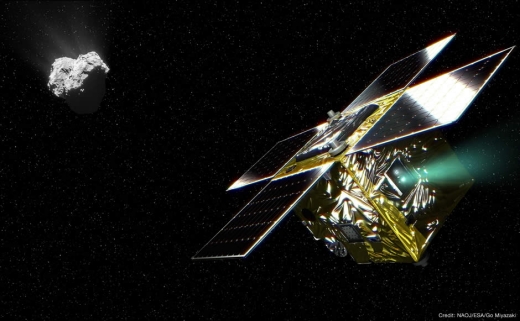
Image: The PROCYON spacecraft and comet 67P/Churumov-Gerasimenko (Conceptual Image). Credit: NAOJ/ESA/Go Miyazaki.
The researchers, from the National Astronomical Observatory of Japan, University of Michigan, Kyoto Sangyo University, Rikkyo University and the University of Tokyo, set out to map the entire hydrogen coma of comet 67P, the same comet studied in such spectacular detail by the European Space Agency’s Rosetta mission. The challenge to Rosetta, however, was that being inside the cometary coma, it could not observe the entire coma structure.
None of this was in the original PROCYON mission, but it became clear that the spacecraft could be valuable in supplementing the Rosetta observations. Rosetta had studied specific areas on the comet, but the researchers wanted an estimate of the total amount of water released by the comet per second, which in turn demanded a model for the coma itself. If Rosetta could not provide the answer, PROCYON could study the coma in its entirety.
Adapting PROCYON/LAICA for a comet proved workable. The hydrogen atoms in a cometary coma come from water molecules ejected from the nucleus which are then broken apart by ultraviolet radiation from the Sun. Coma models based on these processes allowed the team to estimate the water release rate based on a brightness map of the hydrogen atoms.
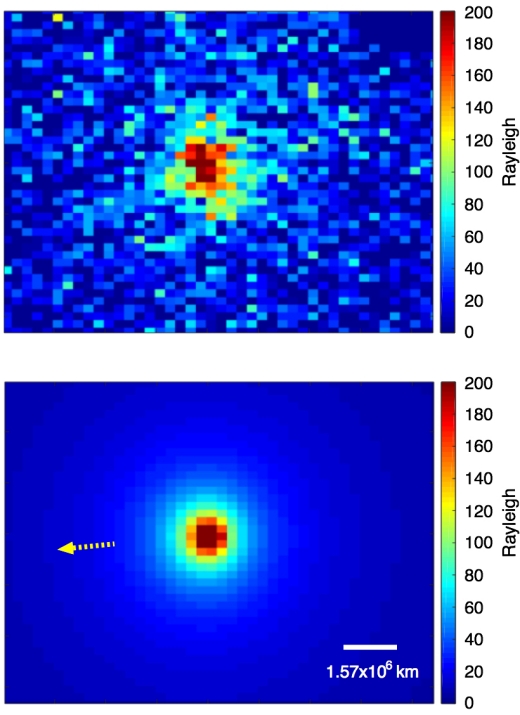
Image: Processed and cropped hydrogen-Lyα image of the comet 67P/C-G in Rayleigh units (upper panel) taken by the LAICA telescope on September 13, 2015 UT and the hydrogen coma appearance predicted by a two-dimensional axi-symmetric model of the atomic hydrogen coma (lower panel). The yellow dotted arrow in the lower panel indicates the direction to the Sun at the time of observation. Credit: NAOJ.
Working with observations of comet 67P’s entire hydrogen coma, the researchers were able to derive its absolute water production rates near the 2015 perihelion. This allowed them to test their developing models for the coma, which could be combined with the Rosetta results to estimate the total ejected mass of the comet during this period. Credit the high spatial resolution of the LAICA instrument and the pointing control of PROCYON for the result.
These are useful results, but let’s also look at what they imply about how we design our missions. PROCYON is a small cube about 60 cm to the side weighing 65 kg. The low-cost mission has been able to support key elements of a much larger mission with additional observations in a way that JAXA believes to be a model for small spacecraft in the future.
As we continue to explore what we can do with CubeSats and other micro-designs, we can think in terms of ‘clusters’ of small spacecraft networking together to reduce overall risk and provide widely dispersed observing platforms for a variety of targets. Swarms of micro-sailcraft to the outer planets are just one scenario that may grow out of spacecraft interactions like these.
The paper is Shinnaka et al. 2017 “Imaging observations of the hydrogen coma of comet 67P/Churyumov-Gerasimenko in September 2015 by the PROCYON/LAICA,” Astronomical Journal, Volume 153, Issue 2, Article number 76 (24 January 2017). Abstract.
Probing the Surface of Ceres
It doesn’t stretch credulity to hypothesize that the early Earth benefited from an influx of comet and asteroid material that contributed water and organic compounds to its composition. The surface of a world can clearly be affected by materials from other bodies in the Solar System. Now we’re learning that the dwarf planet Ceres may have a surface dusted by material from asteroid impacts. The findings come from a team of astronomers investigating Ceres with SOFIA, the airborne Stratospheric Observatory for Infrared Astronomy. The observatory is a highly modified 747SP aircraft carrying a 2.5m reflecting telescope.
The study shows that not just Ceres but other asteroids and dwarf planets may be coated with asteroid fragments, a result that adjusts our view of Ceres’ surface composition. After all, what we’re looking at may simply be the result of asteroid impacts in the early days of the Solar System’s formation. Three quarters of all asteroids, including Ceres, have been classified as type C (carbonaceous) on the basis of their colors, but the SOFIA infrared data show a substantial difference between the dwarf planet and C-type asteroids in nearby orbits.
Carbonaceous asteroids are dark (albedo in the range of 0.03-0.09, on a scale where a white, perfectly reflecting surface has an albedo of 1.0), with a composition depleted in hydrogen, helium and other volatiles. What SOFIA shows us is that Ceres doesn’t fit this model. Pierre Vernazza is a research scientist at the Laboratoire d’Astrophysique de Marseille:
“By analyzing the spectral properties of Ceres we have detected a layer of fine particles of a dry silicate called pyroxene. Models of Ceres based on data collected by NASA’s Dawn as well as ground-based telescopes indicated substantial amounts of water-bearing minerals such as clays and carbonates. Only the mid-infrared observations made using SOFIA were able to show that both types of material are present on the surface of Ceres.”
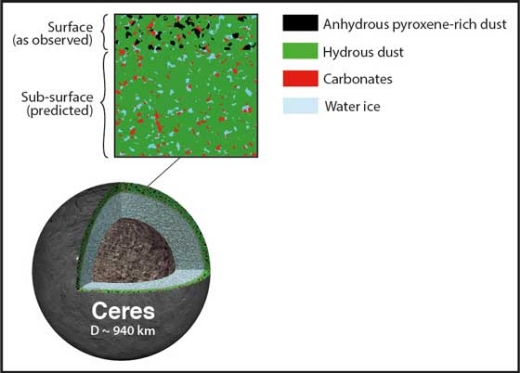
Image: Ceres’ surface is contaminated by a significant amount of dry material while the area below the crust contains essentially water-bearing materials. The mid-infrared observations revealed the presence of dry pyroxene on the surface probably coming from interplanetary dust particles. The Internal structure of the Dwarf Planet Ceres was derived from NASA Dawn spacecraft data. Credit: SETI Institute.
Interplanetary dust particles, according to this SETI Institute news release, are the most likely source for the pyroxene, and are also implicated as having accumulated on other asteroid surfaces. Ceres thus takes on the coloration of some of its drier neighbors, while actually housing more substantial resources of water below. The larger picture is that infrared observations may help us better understand an asteroid’s true composition. Vernazza even speculates that ammoniated clays mixing with watery clay on Ceres may point to an origin in the outer parts of the Solar System, with migration occurring later in the dwarf planet’s life.
“The bottom line is that seeing is not believing when it comes to asteroids,” says Franck Marchis, senior planetary astronomer at the SETI Institute, a researcher who collaborated in this project. “We shouldn’t judge these objects by their covers, as it were.”
Jupiter in the Public Eye
Have a look at Jupiter as seen by the Juno spacecraft on its third close pass. A view as complex as the one below reminds us how images can be manipulated to bring out detail. This happens so frequently in astronomical images that it’s easy to forget this view is not necessarily what the human eye would see, and we always have to check to find out how a given image was processed. In this case, we’re looking at the work of a ‘citizen scientist,’ one Eric Jorgensen, who enhanced a JunoCam image to highlight the cloud movement.
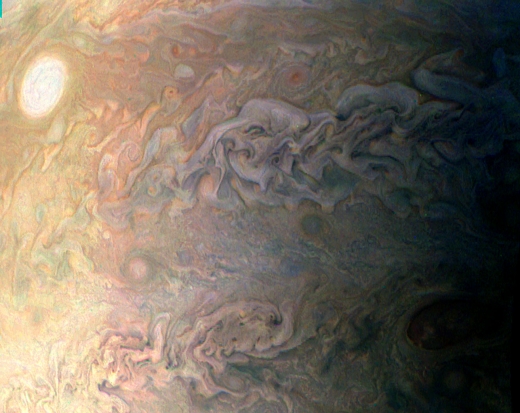
Image: This amateur-processed image was taken on Dec. 11, 2016, at 1227 EST (1727 UTC), as NASA’s Juno spacecraft performed its third close flyby of Jupiter. At the time the image was taken, the spacecraft was about 24,400 kilometers from the gas giant planet. Credit: NASA/JPL-Caltech/SwRI/MSSS/Eric Jorgensen.
The image shows a region of Jupiter southeast of what is known as the ‘pearl,’ one of eight rotating storms at 40 degrees south latitude on the planet, a region of vast and roiling turbulence. Citizen science efforts like Planet Hunters, SETI@Home and Galaxy Zoo have brought private individuals into contact with scientific data and fostered interest in a wide range of sciences, with Planet Hunters rising to particular visibility thanks to its work with Boyajian’s Star and the still mysterious light curves observed there.
The Juno mission is delving into this realm with the announcement that on the spacecraft’s February 2 pass of Jupiter, the public will have had a voice in the selection of targets for the imaging team. As JPL notes in this news release, JunoCam will begin taking pictures as Juno approaches Jupiter’s north pole. Scientists have to keep an eye on onboard storage limitations as they consider which images to collect with JunoCam. Each close pass (‘perijove’) happens in a 2-hour window as the spacecraft goes from the north pole of the giant planet to the south pole, with JunoCam imaging a circumscribed strip of territory.
The voting for the February 2 flyby is still open, but the process repeats: Each orbit will have a voting page, and each perijove on Juno’s 53-day orbit will have space for two polar images within which the public can participate in prioritizing particular points of interest, in accordance with the science goals the mission is trying to meet. Several pages at the voting site will be devoted to unique points of interest that will be within range of JunoCam’s field of view during the next close approach. Raw images will then be made available for processing.
“The pictures JunoCam can take depict a narrow swath of territory the spacecraft flies over, so the points of interest imaged can provide a great amount of detail,” said Juno co-investigator Candy Hansen, (Planetary Science Institute). “They play a vital role in helping the Juno science team establish what is going on in Jupiter’s atmosphere at any moment. We are looking forward to seeing what people from outside the science team think is important.”
Bear in mind that JunoCam was included on the mission because, working in color and visible light, it could offer a wide field of view that would, among other things, spur public interest and involvement. So it’s not surprising to see this citizen science angle being brought forward, offering engagement not just from amateur scientists but students worldwide. Building public support is also a key component in keeping up the pressure for better space funding.
The February 2 flyby makes its closest approach to Jupiter at 0758 EST (1258 UTC), with the spacecraft about 4300 kilometers above the cloud tops. We’ll see Jupiter up close once again through a spacecraft’s lens, translated for us into images that mimic what we would see with our own eyes before we get to work processing them. If you’re interested in having a say on future JunoCam targets, click here for information on how to get involved.
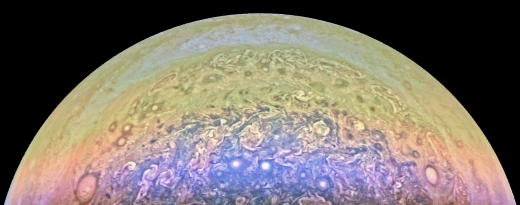
Image: Jupiter’s south pole as seen during perijove 3, in an image processed by Julien Potier (Planetario Silvia Torres Castilleja, Ags, Mexico), rotated, cropped to get rid of yellowish band, processed with RGB levels, brightness, contrast and HDR Toning.
A Vision to Bootstrap the Solar System Economy
Early probes are one thing, but can we build a continuing presence among the stars, human or robotic? An evolutionary treatment of starflight sees it growing from a steadily expanding presence right here in our Solar System, the kind of infrastructure Alex Tolley examines in the essay below. How we get to a system-wide infrastructure is the challenge, one analyzed by a paper that sees artificial intelligence and 3D printing as key drivers leading to a rapidly expanding space economy. The subject is a natural for Tolley, who is co-author (with Brian McConnell) of A Design for a Reusable Water-Based Spacecraft Known as the Spacecoach (Springer, 2016). An ingenious solution to cheap transportation among the planets, the Spacecoach could readily be part of the equation as we bring assets available off-planet into our economy and deploy them for even deeper explorations. Alex is a lecturer in biology at the University of California, and has been a Centauri Dreams regular for as long as I can remember, one whose insights are often a touchstone for my own thinking.
by Alex Tolley

Crewed starflight is going to be expensive, really expensive. All the various proposed methods from slow world ships to faster fusion vessels require huge resources to build and fuel. Even at Apollo levels of funding in the 1960’s, an economy growing at a fast clip of 3% per year is estimated to need about half a millennium of sustained growth to afford the first flights to the stars. It is unlikely that planet Earth can sustain such a sizable economy that is millions of times larger than today’s. The energy use alone would be impossible to manage. The implication is that such a large economy will likely be solar system wide, exploiting the material and energy resources of the system with extensive industrialization.
Economies grow by both productivity improvements and population increases. We are fairly confident that Earth is likely nearing its carrying capacity and certainly cannot increase its population even 10-fold. This implies that such a solar system wide economy will need huge human populations living in space. The vision has been illustrated by countless SciFi stories and perhaps popularized by Gerry O’Neill who suggested that space colonies were the natural home of a space faring species. John Lewis showed that the solar system has immense resources to exploit that could sustain human populations in the trillions.
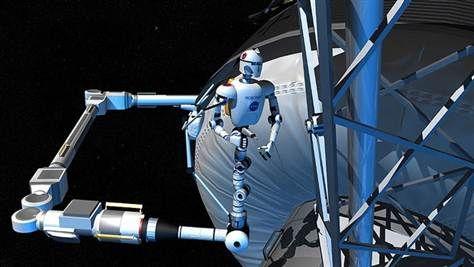
Image credit: John Frassanito & Associates
But now we run into a problem. Even with the most optimistic estimates of reduced launch costs, and assuming people want to go and live off planet probably permanently, the difficulties and resources needed to develop this economy will make the US colonization by Europeans seem like a walk in the park by comparison. No doubt it can be done, but our industrial civilization is little more than a quarter of a millennium old. Can we sustain the sort of growth we have had on Earth for another 500 years, especially when it means leaving behind our home world to achieve it? Does this mean that our hopes of vastly larger economies, richer lives for our descendents and an interstellar future for humans is just a pipe dream, or at best a slow grind that might get us there if we are lucky?
Well, there may be another path to that future. Philip Metzger and colleagues have suggested that such a large economy can be developed. More extraordinary, that such an economy can be built quickly and without huge Earth spending, starting and quickly ending with very modest space launched resources. Their suggestion is that the technologies of AI and 3D printing will drive a robotic economy that will bootstrap itself quickly to industrialize the solar system. Quickly means that in a few decades, the total mass of space industrial assets will be in the millions of tonnes and expanding at rates far in excess of our Earth-based economies.
The authors ask, can we solve the launch cost problem by using mostly self-replicating machines instead? This should remind you of the von Neumann replicating probe concept. Their idea is to launch seed factories of almost self-replicating robots to the Moon. The initial payload is a mere 8 tonnes. The robots will not need to be fully autonomous at this stage as they can be teleoperated from Earth due to the short 2.5 second communication delay. They are not fully self-replicating at this stage as need for microelectronics is best met with shipments from Earth. Almost complete self-replication has already been demonstrated with fabs, and 3D printing promises to extend the power of this approach.
The authors assume that initial replication will neither be fully complete, nor high fidelity. They foresee the need for Earth to ship the microelectronics to the Moon as the task of building fabs is too difficult. In addition, the materials for new robots will be much cruder than the technology earth can currently deliver, so that the next few generations of robots and machinery will be of poorer technology than the initial generation. However the quality of replication will improve with each generation and by generation 4, a mere 8 years after starting, the robot technology will be at the initial level of quality, and the industrial base on the Moon should be large enough to support microelectronics fabs. From then on, replication closure is complete and Earth need ship no further resources to the Moon.
| Gen | Human/Robotic Interaction | Artificial Intelligence | Scale of Industry | Materials Manufactured | Source of Electronics |
|---|---|---|---|---|---|
| 1.0 | Teleoperated and/or locally operated by a human outpost | Insect-like | Imported, small-scale, limited diversity | Gases, water, crude alloys, ceramics, solar cells | Import fully integrated machines |
| 2.0 | Teleoperated | Lizard-like | Crude fabrication, inefficient, but greater throughput than 1.0 | (Same) | Import electronics boxes |
| 2.5 | Teleoperated | Lizard-like | Diversifying processes, especially volatiles and metals | Plastics, rubbers, some chemicals | Fabricate crude components plus import electronics boxes |
| 3.0 | Teleoperated with experiments in autonomy | Lizard-like | Larger, more complex processing plants | Diversify chemicals, simple fabrics, eventually polymers | Locally build PC cards, chassis and simple components, but import the chips |
| 4.0 | Closely supervised autonomy | Mouse-like | Large plants for chemicals, fabrics, metals | Sandwiched and other advanced material processes | Building larger assets such as lithography machines |
| 5.0 | Loosely supervised autonomy | Mouse-like | Labs and factories for electronics and robotics. Shipyards to support main belt. | Large scale production | Make chips locally. Make bots in situ for export to asteroid belt. |
| 6.0 | Nearly full autonomy | Monkey-like | Large-scale, self-supporting industry, exporting industry to asteroid main belt | Makes all necessary materials, increasing sophistication | Makes everything locally, increasing sophistication |
| X.0 | Autonomous robotics pervasive throughout Solar System enabling human presence | Human-like | Robust exports/imports through zones of solar system | Material factories specialized by zone of the Solar System | Electronics factories in various locations |
Table 1. The development path for robotic space industrialization. The type of robots and the products created are shown. Each generation takes about 2 years to complete. Within a decade, chip fabrication is initiated. By generation 6, full autonomy is achieved.
| Asset | Qty. per set | Mass minus Electronics (kg) | Mass of Electronics (kg) | Power (kW) | Feedstock Input (kg'hr) | Product Output (kg/hr) |
|---|---|---|---|---|---|---|
| Power Distrib & Backup | 1 | 2000 | ----- | ---- | ---- | ---- |
| Excavators (swarming) | 5 | 70 | 19 | 0.30 | 20 | ---- |
| Chem Plant 1 - Gases | 1 | 733 | 30 | 5.58 | 4 | 1.8 |
| Chem Plant 2 - Solids | 1 | 733 | 30 | 5.58 | 10 | 1.0 |
| Metals Refinery | 1 | 1019 | 19 | 10.00 | 20 | 3.15 |
| Solar Cell Manufacturer | 1 | 169 | 19 | 0.50 | 0.3 | ---- |
| 3D Printer 1 - Small Parts | 4 | 169 | 19 | 5.00 | 0.5 | 0.5 |
| 3D Printer 2 - Large Parts | 4 | 300 | 19 | 5.00 | 0.5 | 0.5 |
| Robonaut assemblers | 3 | 135 | 15 | 0.40 | ---- | ---- |
| Total per Set | ~7.7 MT launched to Moon | 64.36 kW | 20 kg regolith/hr | 4 kg parts/hr |
||
Table 2. The products and resources needed to bootstrap the industrialization of the Moon with robots. Note the low mass needed to start, a capability already achievable with existing technology. For context, the Apollo Lunar Module had a gross mass of over 15 tonnes on landing.
The authors test their basic model with a number of assumptions. However the conclusions seem robust. Assets double every year, more than an order of magnitude faster than Earth economic growth.
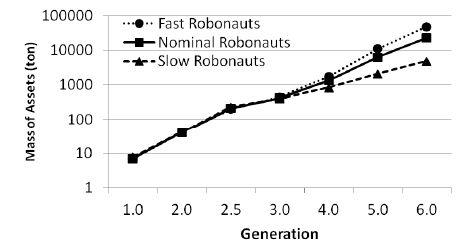
Figure 13 of the Metzger paper shows that within 6 generations, about 12 years, the industrial base off planet could potentially be pushing towards 100K MT.
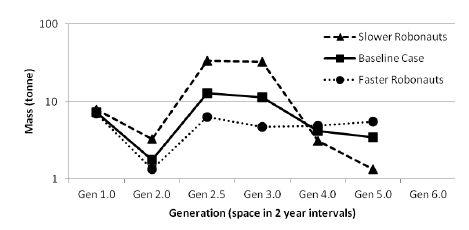
Figure 14 of the paper shows that with various scenarios for robots, the needed launch masses from Earth every 2 years is far less than 100 tonnes and possibly below 10 tonnes. This is quite low and well within the launch capabilities of either government or private industry.
Once robots become sophisticated enough, with sufficient AI and full self-replication, they can leave the Moon and start industrializing the asteroid belt. This could happen a decade after initiation of the project.
With the huge resources that we know to exist, robot industrialization would rapidly, within decades not centuries, create more manufactures by many orders of magnitude than Earth has. Putting this growth in context, after just 50 years of such growth, the assets in space would require 1% of the mass of the asteroid belt, with complete use within the following decade. Most importantly, those manufactures, outside of Earth’s gravity well, require no further costly launches to transmute into useful products in space. O’Neill colonies popped out like automobiles? Trivial. The authors suggest that one piece could be the manufacture of solar power satellites able to supply Earth with cheap, non-polluting power, in quantities suitable for environmental remediation and achieving a high standard of living for Earth’s population.
With such growth, seed factories travel to the stars and continue their operation there, just as von Neumann would predict with his self-replicating probes. Following behind will be humans in starships, with habitats already prepared by their robot emissaries. All this within a century, possibly within the lifetime of a Centauri Dreams reader today.
Is it viable? The authors believe the technology is available today. The use of telerobotics staves off autonomous robots for a decade. In the 4 years since the article was written, AI research has shown remarkable capabilities that might well increase the viability of this aspect of the project. It will certainly need to be ready once the robots leave the Moon to start extracting resources in the asteroid belt and beyond.
The vision of machines doing the work is probably comfortable. It is the fast exponential growth that is perhaps new. From a small factory launched from Earth, we end up with robots exploiting resources that dwarf the current human economy within a lifetime of the reader.
The logic of the model implies something the authors do not explore. Large human populations in space to use the industrial output of the robots in situ will need to be launched from Earth initially. This will remain expensive unless we are envisaging the birthing of humans in space, much as conceived for some approaches to colonizing the stars. Alternatively an emigrant population will need to be highly reproductive to fill the cities the robots have built. How long will that take? Probably far longer, centuries, rather than the decades of robotic expansion.
Another issue is that the authors envisage the robots migrating to the stars and continuing their industrialization there. Will humans have the technology to follow, and if so, will they continue to fall behind the rate at which robots expand? Will the local star systems be full of machines, industriously creating manufactures with only themselves to use them? And what of the development of AI towards AGI, or Artificial General Intelligence? Will that mean that our robots become the inevitable dominant form of agency in the galaxy?
The paper is Metzger, Muscatello, Mueller & Mantovani, “Affordable, Rapid Bootstrapping of the Space Industry and Solar System Civilization,” Journal of Aerospace Engineering Volume 26 Issue 1 (January 2013). Abstract / Preprint.
A Possible Planet Hidden in the Data
One of the great joys of science is taking something that seems beyond reach and figuring out a way to do it. We can use a coronagraph, for example, to screen out much of the light of a star to see planets around it, but coronagraphs can only do so much, as planets too near the star are still hidden from view. Now scientists have used an unusual observation to deduce information about one such hidden planet and its interactions with a circumstellar disk.
Announced at the recent meeting of the American Astronomical Society, the work involves 18 years of archival observations with the Hubble Space Telescope, which have yielded an intriguing shadow sweeping across the disk of the TW Hydrae system. We’re evidently looking at a young planetary system in formation, as the star — slightly less massive than the Sun and about 192 light years away in the constellation Hydra — is only about 8 million years old. Helpfully for our work, the TW Hydrae disk is seen face-on from our perspective.
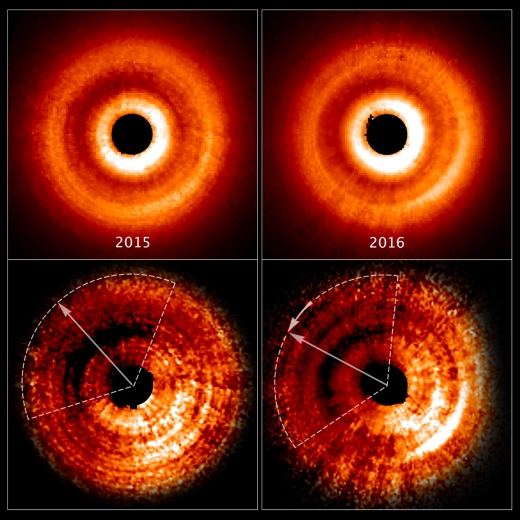
Image: These images, taken a year apart by NASA’s Hubble Space Telescope, reveal a shadow moving counterclockwise around a gas-and-dust disk encircling the young star TW Hydrae. The two images at the top, taken by the Space Telescope Imaging Spectrograph, show an uneven brightness across the disk. Through enhanced image processing (images at bottom), the darkening becomes even more apparent. These enhanced images allowed astronomers to determine the reason for the changes in brightness. The dimmer areas of the disk, at top left, are caused by a shadow spreading across the outer disk. The dotted lines approximate the shadow’s coverage. The long arrows show how far the shadow has moved in a year (from 2015-2016), which is roughly 20 degrees. Credit: NASA, ESA, and J. Debes (STScI).
We have no other circumstellar disk with an archival dataset this rich, allowing the effect to be studied in depth. John Debes (Space Telescope Science Institute, Baltimore) was able to put observations from Hubble’s Space Telescope Imaging Spectrograph (STIS) together with images from different observing runs, some of which included the Hubble Near Infrared Camera and Multi-Object Spectrometer (NICMOS).
The STIS observations use the instrument’s coronagraph to look close to the star, but the coronagraph still can’t reveal an image of the planet itself. The shadow, however, is another matter. It has swept around the disk counter-clockwise until returning in 2016 to the same position it was in in 2000. The disk’s slow rotation ruled out a feature that was itself a part of the disk, implicating a shadow caused by a tilt to the inner disk relative to the outer. Observations from the Atacama Large Millimeter Array (ALMA) at submillimeter wavelengths backed the idea.
Debes believes a hitherto unseen planet is the most likely cause of the twisted inner disk, pulling material out of the disk plane to block light from the star, thus producing the shadow sweeping across the outer disk. If this is the case, we are talking about a planet roughly 160 million kilometers from the star, too close to observe even with STIS, which can penetrate as close to the star as the orbit of Saturn (roughly 1.5 billion kilometers).
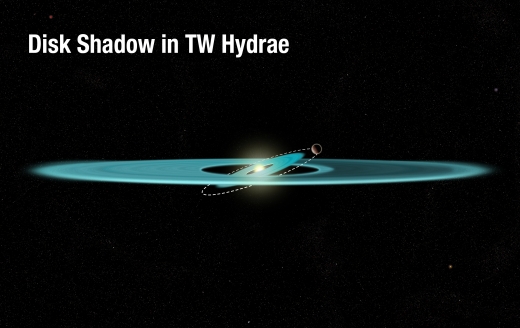
Image: This diagram reveals the proposed structure of a gas-and-dust disk surrounding the nearby, young star TW Hydrae. The illustration shows an inner disk that is tilted due to the gravitational influence of an unseen companion, which is orbiting just outside the disk. Credit: NASA, ESA, and A. Feild (STScI).
To produce the effects Hubble has noted, the planet would need to be about the size of Jupiter. Recent work on TW Hydrae with ALMA has confirmed a gap in the disk about 14.5 million kilometers from the star, perhaps the signature of another planet clearing the inner disk. Thus we are working with a phenomenon that allows us to study early planet formation in an inner system that is otherwise inaccessible, simply by measuring these broad effects.
“What is surprising is that we can learn something about an unseen part of the disk by studying the disk’s outer region and by measuring the motion, location, and behavior of a shadow,” Debes said. “This study shows us that even these large disks, whose inner regions are unobservable, are still dynamic, or changing in detectable ways which we didn’t imagine.”

Follow with RSS or E-Mail
