Centauri Dreams
Imagining and Planning Interstellar Exploration
TOI 1231b: A Useful Temperate Sub-Neptune
The beauty of nearby M-dwarf stars for exoplanet research is the depth of transits. If we are fortunate enough to find a planet crossing the face of the star as seen from our observatory, the star’s small size means a larger portion of its light will be attenuated. As you would imagine, this makes planets easier to spot, but the other significant advantage is that we have greater capability at analyzing the planet’s atmosphere.
TOI-1231b certainly fits the bill, although it’s a bit of an anomaly in the TESS universe. The space observatory operates with a built in observational bias because the Science Processing Operations Center (SPOC) pipeline and the Quick Look Pipeline (QLP) that comb through TESS data on a 2-minute and 30 minute cadence respectively have to show two transits for the planet’s period to be determined. Factor in that most of the TESS sky coverage is observed for 28 days and you wind up in the majority of cases with detections of planets with orbital periods of less than 14 days.
TOI-1231b’s period is 24 days, a nice catch given these constraints. The planet is a temperate sub-Neptune whose host star, NLTT 24399, is roughly 88 light years from the Sun. Already lead author Jennifer Burt (JPL) and team have been able to measure both the radius and mass of the planet, with followup data from the Planet Finder Spectrograph (PFS) on the Magellan Clay telescope at Las Campanas Observatory (Chile), as well as Las Cumbres Observatory and the Antarctica Search for Transiting ExoPlanets. From these parameters it was possible to calculate the planet’s density.
The temperatures on this world are calculated at 330 K (60 degrees Celsius), making TOI-1231b one of the lowest temperature exoplanets yet found whose atmosphere can be studied through transmission spectroscopy. The star is bright in the near-infrared (NIR), suggesting it will be a useful target for the James Webb Space Telescope as well as Hubble. One of the paper’s co-authors will be using the latter to mount a new series of observations within the month. Co-author Diana Dragomir (University of New Mexico) describes the team’s findings thus far:
“The low density of TOI 1231b indicates that it is surrounded by a substantial atmosphere rather than being a rocky planet. But the composition and extent of this atmosphere are unknown. TOI1231b could have a large hydrogen or hydrogen-helium atmosphere, or a denser water vapor atmosphere. Each of these would point to a different origin, allowing astronomers to understand whether and how planets form differently around M dwarfs when compared to the planets around our Sun, for example. Our upcoming HST observations will begin to answer these questions, and JWST promises an even more thorough look into the planet’s atmosphere.”
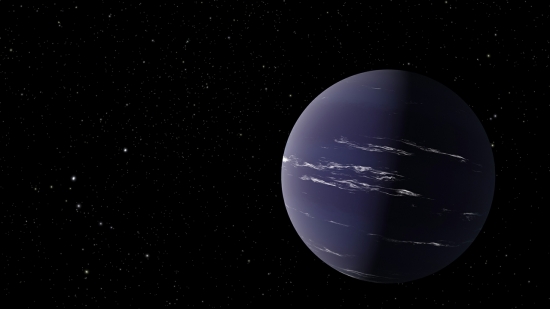
Image: An artist’s rendering of TOI-1231 b, a Neptune-like planet about 88 light years from Earth. Credit: NASA/JPL-Caltech.
One interesting aspect of this detection is the possibility of observing hydrogen and helium surrounding the planet because of its relatively low gravitational well and expected exposure to X-ray and ultraviolet radiation from the star. Moreover, there is only one other low-density temperate sub-Neptune, K2-18 b, currently in our catalog. It has temperatures in the 250-350 K range and a transmission spectrum that allows us to analyze its atmosphere, where evidence for water vapor has been found. Thus TOI 1231b should be useful as a check on how common water cloud formation in temperate sub-Neptunes may be.
All told, say the authors, “TOI 1231 b appears to be one of the most promising small exoplanets for transmission spectroscopy with HST and JWST detected by the TESS mission thus far.” A valuable find as we keep drilling down to analyze the atmospheres of ever smaller worlds, moving toward Earth-mass planets in the habitable zone.
The paper is Burt et al., “TOI-1231 b: A Temperate, Neptune-Sized Planet Transiting the Nearby M3 Dwarf NLTT 24399,” in process at The Astronomical Journal (preprint).

When Will We See an Ice Giant Orbiter?
With NASA announcing that its Discovery program would fund both Davinci and Veritas, two missions to Venus, it’s worth pausing to consider where we are in the realm of Solar System exploration. This is not to knock the Venus decisions; this is a target that has been neglected compared to, obviously, Mars, and we’ve kept it on the back burner while exploring Jupiter, Saturn and, with a fast flyby, Pluto/Charon. With budgets always tight, the axe must fall, and fall it has on the promising Trident.
Discovery-class involves small-scale missions that cost less than $500 million to develop. The Trident mission would have delivered imagery from Triton that upgraded the 1989 images from Voyager 2, useful indeed given the moon’s active surface, and we might have learned about the presence of a subsurface ocean. I should also mention that we lost IVO when the four candidate missions were pared down to two. IVO (Io Volcano Observer) had a strong case of its own, with close flybys of the tortured geology on the most volcanically active body in the Solar System.
So on to Venus, but let’s consider how the next few decades are shaping up. We have flown orbital missions to every planet in the Solar System other than the two ice giants, and it’s worth considering how many questions about those worlds were suggested by the Voyager 2 flybys of Uranus and Neptune. Imagine if all we had of Saturn were flyby images, conceivably missing the active plume activity on Enceladus. What kind of startling data might an ice giant orbiter return that Voyager 2 didn’t see in its brief encounters?
The ice giants are a class of planet that, as the 2013 Planetary Science Decadal Survey stated “are… one of the great remaining unknowns in the solar system, the only class of planet that has never been explored in detail.” A Uranus Orbiter and Probe was, in fact, the third-highest priority large-class mission named by the report, but it’s clear that we won’t have such a mission in time for the 2030-2034 launch window needed (more on this in a moment). Despite that, let’s switch the focus to Uranus because of a short report from the 2020 Lunar and Planetary Science Conference that Ashley Baldwin forwarded.
There are all kinds of reasons why Uranus makes an interesting target. In addition to its status as an ice giant, Uranus has both a ring system and unusual moons, with five major satellites that may be ocean worlds and in any case show dramatic surface features. The seventh planet also sports a major tilt in both rotational and magnetic axes, and a wind circulation structure that is little understood. In the absence of a major orbiter mission, the brief paper Ashley sent examines the issues involved in sending a much smaller New Frontiers class orbiter with faster turnaround.
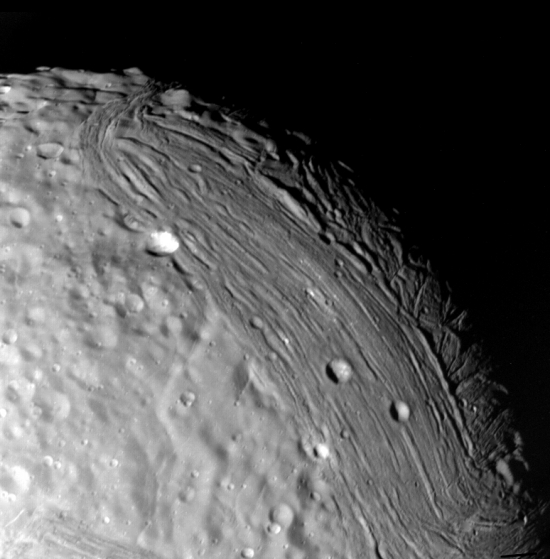
Image: Uranus’ moon Miranda sports one of the strangest and most varied landscapes among extraterrestrial bodies, including three large features known as “coronae,” which are unique among known objects in our solar system. They are lightly cratered collections of ridges and valleys, separated from the more heavily cratered (and presumably older) terrain by sharp boundaries like mismatched patches on a moth-eaten coat. Miranda’s giant fault canyons are as much as 12 times as deep as the Grand Canyon. This image was acquired by Voyager 2 on Jan. 24, 1986, around its close approach to the Uranian moon. Credit: JPL.
Back to that launch window I mentioned earlier. The 2030-2034 timeframe for Uranus would allow the needed Jupiter gravity assist that would get the payload to target before it reaches equinox in 2049. This is an important point: We’d like to see the northern hemispheres of the satellites — Voyager 2 could not see these — and after equinox they will once again become dark. A New Frontiers-class orbiter might just make the deadline, but it’s hard to see such a mission being funded in time. NASA now says the next opportunity to propose for the fifth round of New Frontiers missions will be no later than the fall of 2024.
New Horizons is a New Frontiers-class mission, as is OSIRIS-REx and Juno, all the subject of competitive selection through the program, which focuses on medium-scale missions that cost less than $850 million to develop. Within that cost envelope, a Uranus orbiter is a tricky proposition. The total mission duration cited in the paper is fourteen years because of the flight design life of the needed Multi-Mission Radioisotope Thermoelectric Generators (MMRTGs). Thus the baseline is a two year mission in orbit at Uranus with mapping of the entire system, all completed by Uranus spring equinox in 2049, “enabling different illuminations of the satellites and seasonal orientation of the planet and magnetosphere than observed by Voyager 2.”
Other issues: How to achieve orbital insertion at Uranus? Aerocapture seems a reasonable possibility and would have to be considered. The paper cites a 60-kg payload including five instruments along with radio science capabilities, and goes on to note that power is the most limiting constraint on a mission like this under New Frontiers cost limits. Here’s what the paper says about the power question:
…addressing power within cost is the primary obstacle to the feasibility of a NF Uranus orbiter mission. Previous Ice Giant mission studies have resulted in architectures requiring >350 W-e end-of-life power, which requires six MMRTGs. Owing to the relative inefficiency and significant cost of MMRTGs, any design should attempt to reduce the needed end-of-life power; this will have significant impact on both the spacecraft and orbit design as well as the communication subsystem and payload.
And of course we have this:
Other design considerations that place significant constraints on the feasibility of a NF Uranus orbiter include deep-space communications (specifically the power required for downlink) and radiation shielding mass.
Not an easy task. But this is what we face as we look beyond the current selections in the Discovery program. We’d all like to see an orbiter around both ice giants, but given the realities of time and budget, the likelihood of getting one around either before mid-century is slim. Eventually it will get done, and new technologies will make for a more efficient design and a more comprehensive mission. Sadly, the timeframe for seeing all this happen stretches a long way ahead.
Many of us find this frustrating. But the overview is that the exploration of the Solar System and the push beyond is a civilizational project that dwarfs human lifetimes. The things we can accomplish today build the basis for projects our children will complete. We push the limits of what we have, drive technology forward, and refuse to stop trying.
The paper is Cohen et al., “New Frontiers-class Uranus Orbiter: A Case For Exploring The Feasibility of Achieving Multidisciplinary Science With a Mid-scale Mission,” 51st Lunar and Planetary Science Conference (2020). Full text.
Juno: Close Pass by Ganymede
The Juno spacecraft swings by Ganymede today, coming within 1,038 kilometers of the largest moon of Jupiter. We have to look back over twenty years to see such a close approach to Ganymede, that one conducted by the Galileo probe in 2000. Juno seems to be one of those gifts that keeps on giving, rewarding us now with new data on Ganymede’s composition, tenuous ionosphere, magnetosphere and icy surface, likely a shell over an underlying ocean.
Scott Bolton (SwRI) is Juno’s principal investigator:
“Juno carries a suite of sensitive instruments capable of seeing Ganymede in ways never before possible. By flying so close, we will bring the exploration of Ganymede into the 21st century, both complementing future missions with our unique sensors and helping prepare for the next generation of missions to the Jovian system – NASA’s Europa Clipper and ESA’s [European Space Agency’s] JUpiter ICy moons Explorer [JUICE] mission.”
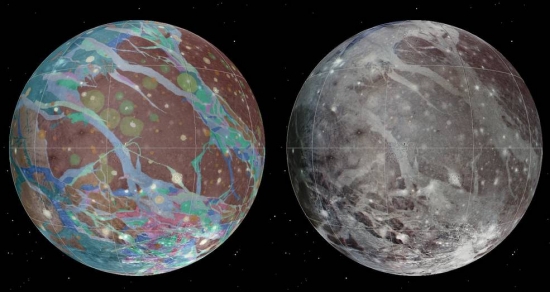
Image: Left to right: The mosaic and geologic maps of Jupiter’s moon Ganymede were assembled incorporating the best available imagery from NASA’s Voyager 1 and 2 spacecraft and NASA’s Galileo spacecraft. Credits: USGS Astrogeology Science Center/Wheaton/NASA/JPL-Caltech.
The closest approach occurs at 13:35 EDT (17:35 UTC), with the craft’s science instruments beginning collecting data some three hours earlier. Especially useful here will be the Ultraviolet Spectrograph (UVS) and Jovian Infrared Auroral Mapper (JIRAM) instruments, while the Microwave Radiometer (MWR) will draw information on the composition and temperature of the crust. Bolton again:
“Ganymede’s ice shell has some light and dark regions, suggesting that some areas may be pure ice while other areas contain dirty ice. MWR will provide the first in-depth investigation of how the composition and structure of the ice varies with depth, leading to a better understanding of how the ice shell forms and the ongoing processes that resurface the ice over time.”
The animation below gives a sense of Ganymede’s geology:
Animation: A rotating globe of Ganymede, with a geologic map superimposed over a global color mosaic. Credit: USGS Astrogeology Science Center/Wheaton/ASU/NASA/JPL-Caltech.
Remember that JUICE is scheduled for launch in 2022, with multiple flybys of Europa and Callisto planned before the spacecraft moves into orbit around Ganymede, so everything we learn today with Juno will provide additional planning fodder for the mission. JUICE will fly with ice-penetrating radar, an instrument called RIME (Radar for Icy Moon Exploration) that is capable of penetrating up to 10 kilometers of ice and reflecting off subsurface features. That should obviously come in handy not just on Ganymede but Europa and Callisto as well.
A radio occultation experiment is planned for the Juno flyby using the spacecraft’s X-band and Ka-band wavelengths as a probe of the moon’s ionosphere, where solar radiation excites stray gases to form detectable ions. When Juno moves behind Ganymede, the changes in frequency observed as the radio signals pass through the ionosphere will be detected at the Deep Space Network Canberra complex in Australia. A solid reading here would be useful as scientists try to learn more not only about Ganymede’s ionosphere but also its magnetosphere. Larger than the planet Mercury, Ganymede is the only moon in the Solar System to have its own magnetosphere, a region of charged particles that form a bubble around the small world.
This will be a busy week for Juno mission scientists, with the close pass of Ganymede followed less than 24 hours later with the 33rd science pass of Jupiter. Juno’s JunoCam imager should be able to take images of Ganymede at a resolution equivalent to the best returned by Voyager and Galileo, a set of imagery that can be scanned for changes over the four decade period. Of relevance here will be new craters as we try to learn more about impacts in the outer system.
Meanwhile, the Juno Stellar Reference Unit (SRU) navigation camera should collect images with a particular import, telling us something about the radiation environment at Ganymede. Heidi Becker (JPL) is Juno radiation monitoring lead:
“The signatures from penetrating high-energy particles in Jupiter’s extreme radiation environment appear as dots, squiggles, and streaks in the images – like static on a television screen. We extract these radiation-induced noise signatures from SRU images to obtain diagnostic snapshots of the radiation levels encountered by Juno.”
A third camera is the Advanced Stellar Compass, which will measure energetic electrons penetrating its shielding every quarter of a second. NASA points out that from the perspective of Juno, Ganymede will go from being a point of light to a visible disk and back to a point of light in a mere 25 minutes, moving past the moon at about 19 kilometers per second. The ensuing Jupiter close pass will occur at 58 kilometers per second. Fast times above the cloud tops.
The Oort Cloud and Close Stellar Encounters
If we assume that the Oort Cloud, that enveloping shroud of comets that surrounds our Solar System and extends to 100,000 AU or beyond, is a common feature of stellar systems, then it’s conceivable that objects are interchanged between the Sun and Alpha Centauri where the two clouds approach each other. That makes for the ‘slow boat to Centauri’ concept I’ve written about before, where travel between the stars essentially mines resources along the way in migrations lasting thousands of years. The resulting society would not be planet-oriented.
When the Dutch astronomer Jan Hendrik Oort deduced the cloud’s existence, he theorized that there was an inner, disk-shaped component as well as an outer, spherical cloud, as shown in the image below. The outer cloud is only loosely bound to the Sun, making the interchange of cometary materials between stars a likely event over the aeons, while gravitational nudges from passing stars can dislodge comets in the other direction as well, causing them to move toward the inner system. Most long-period comets probably come from the Oort Cloud.

Image: Artist’s impression of the Oort cloud. The density has been hugely exaggerated. (c) Pablo Carlos Budassi [CC BY-SA 4.0] via Wikimedia.
I should also mention that we can find the Oort Cloud concept, though obviously not that name, discussed in the work of the Estonian astronomer Ernst Öpik in 1932, which is why you sometimes see the cometary cloud referred to as the Öpik–Oort Cloud. Compared to it, the Kuiper Belt is practically in our backyard at 30 to 50 AU. We’ve pushed probes into the Kuiper Belt, but it’s a matter of pure speculation when we’ll have the technologies to reach the Oort, though of course any future interstellar probes will need to pass through this region. Not to worry, though; comets out here are presumed to be tens of millions of kilometers apart.
At Leiden University in the Netherlands, Simon Portegies Zwart has run simulations mapping the growth of the Oort Cloud that are to be presented in a forthcoming paper in Astronomy & Astrophysics. The work confirms the idea that the Oort is a remnant of the protoplanetary disk from which the Solar System grew some 4.6 billion years ago. While much of it comes from comets ejected from the young Solar System by the gas- and ice-giant planets, the research team suggests that a second population of comets comes from other stars.
Bear in mind that at the Sun’s birth, numerous other stars would have been nearby, from which objects in their circumstellar disks could have been exchanged, along with free-floating debris in the parent star cluster and other interstellar objects. Indeed, a high percentage of the Oort Cloud’s material could have come from such sources, as the paper notes: “About half the inner Oort cloud, between 100 and 104 au, and a quarter of the material in the outer Oort cloud ? 104 au could be non-native to the Solar system but was captured from free-floating debris in the cluster or from the circumstellar disk of other stars in the birth cluster.”
Let’s look further into the paper on how mass moves around as the Cloud is formed:
According to Cai et al. (2019) 20–80% (with an average of 50%) of the circumstellar material survives the first 100 Myr of its evolution in the parent cluster. The majority of this mass is lost through encounters with other stars. The amount of material lost from the solar system in the simulation presented here falls in this range, meaning that the circumstellar disk has lost about half its mass due to interactions with other stars in the parent cluster, or about 100 M? to 3000 M?. Each of the other processes results in a mass loss of roughly 20%. A small fraction of the ejected asteroids acquire bound orbits in the Oort cloud.
The transport of material from one star to another is seen in the simulations to be “rather symmetric.” While the Solar System is what the authors call “a copious polluter of interstellar space,” so too is it receiving material from other systems. The authors argue that stars in the Sun’s birth cluster would have experienced numerous encounters with other stars, and that the Solar System shows evidence of both single strong encounters and a series of relatively weak encounters, based on the orbital parameters of Sedna and the complexity of the orbits found in the scattered Kuiper Belt beyond 45 AU.
These simulations demonstrate that the Oort Cloud evolved using materials from numerous sources. Here is how lead author Portegies Zwart puts the matter:
“With our new calculations, we show that the Oort cloud arose from a kind of cosmic conspiracy, in which nearby stars, planets and the Milky Way all play their part. Each of the individual processes alone would not be able to explain the Oort cloud. You really need the interplay and the right choreography of all the processes together. And that, by the way, can be explained quite naturally from the Sun’s birth environment. So although the Oort cloud is complicatedly formed, it is probably not unique.”
The paper is Zwart et al., “Oort cloud Ecology II: The chronology of the formation of the Oort cloud,” accepted at Astronomy & Astrophysics (preprint).

Analyzing White Dwarf Debris Disks
You can blame H. G. Wells’ The Time Machine for my interest in the Earth’s far future. That swollen red Sun at the end of the novel created vivid ‘end of the world’ scenarios for me as a boy, and later I would learn that outer planets or moons around a G-class star might turn habitable once it became a red giant. But it would only be in the last few years that I learned how robust the investigations into white dwarf systems — the fate of a red giant — have become, and now we’re finding out not only that such stars can retain planets, but can conceivably create new ones through an emerging disk packed with the pulverized dust of remnant materials like asteroids.
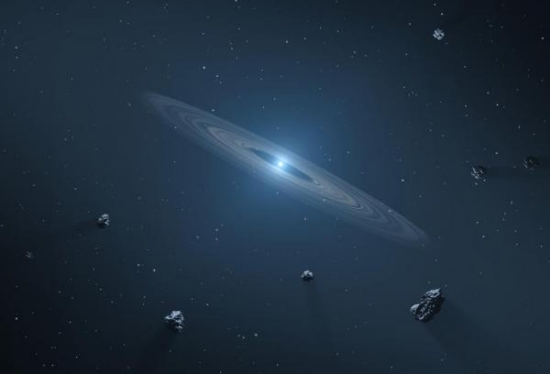
Image: This artist’s concept shows a white dwarf debris disk. Credit: NASA/JPL-Caltech.
Jordan Steckloff (Planetary Science Institute, Tucson) has just published a short paper on the matter, looking at how white dwarf debris disks emerge. The disks seem to form only after ten to twenty million years following the end of the red giant phase. And a turbulent phase it is, with stars like the Sun losing a large proportion of their mass before they turn into a white dwarf. The dwarf itself is Earth-sized and only about half as massive as the star that gave birth to it.
The process of mass loss and collapse into a white dwarf exerts a destabilizing effect on those planets that have not already been swallowed up by the red giant (Mercury, Venus, and most likely Earth will be lost this way). Whether or not planets beyond a few AU of the star survive, their disrupted orbits can result in turmoil within the asteroid population of the system, with some of them falling toward the dwarf star, to be pulverized into dust by these gravitational interactions. Steckloff and team noticed the fact that a process of debris disk formation which ought to occur quickly takes shape only after the delay mentioned above. What is it that is holding back the formation of a debris disk for millions of years? The scientist explains:
“We found that this delay is a result of these young white dwarfs being extremely hot. So hot that any dust that forms from a tidally disrupted asteroid rapidly vaporizes and dissipates. We found that this dust only stops vaporizing after the white dwarf has had time to sufficiently cool down, to a surface temperature of approximately 27,000 degrees kelvin (48,000 degrees Fahrenheit). This temperature agrees with observations of these white dwarf systems; all dusty debris disks are found around white dwarfs cooler than this critical temperature.”
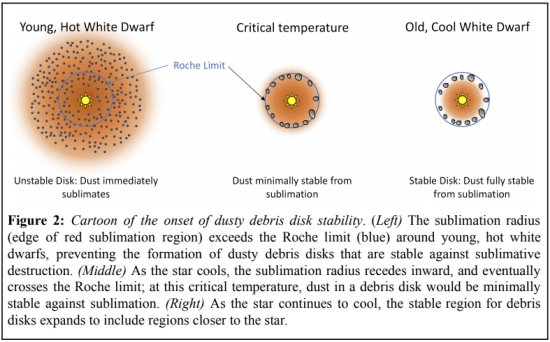
Image: This is Figure 2 from the paper. Credit: Steckloff et al.
Thus our own Solar System, several billion years down the road, should see the Sun enter its red giant phase and ultimately be trasformed into a white dwarf, with the result, according to Steckloff, that Jupiter will migrate outward, thoroughly disrupting the asteroid belt and sending enough of the asteroids close to the Sun to begin the formation of a dusty debris disk. While it is true that the formation process of a debris disk like this should favor hot young stars, whose planetary systems are more unstable, the dwarf star must cool first to the needed temperatures.
Steckloff’s material sublimation model shows the interplay of thermal and tidal forces within the regions around a white dwarf where dusty debris disks can form. The temperatures involved vary somewhat depending on the size of the white dwarf, with more massive stars forming disks at somewhat warmer temperatures. There is also the interesting twist that extremely cool white dwarfs may have more than one debris disk. We see this is a system tagged LSPM J0207+3331, which may be hosting disks formed from the disruption of two planetesimals.
This is the coldest, oldest white dwarf known with a dusty debris disk, according to the paper, and there appears to be a gap within the disk which can also be explained another way:
The apparent gap in this disk is curious and unexpected, and, analogous to protoplanetary disks, may point to the presence of a dense planet clearing a gap along its orbit from within the disk (as proposed for the SDSS J122859.93+104032.9 system; Manser et al. 2019) or a planet sitting outside the Roche limit opening a gap via resonant dynamics. Similar dynamical processes may be at work in dusty debris disks around white dwarfs and the ~3 Gyr cooling age of this white dwarf provides ample time for such dynamical processes to occur.
Whichever possibility is true, this system demonstrates that the environment around white dwarf stars appears to be a lively one. The paper gives us insight into how the physical processes at work restrict the formation of dusty debris disks to white dwarfs that have sufficiently cooled.
The paper is Steckloff et al., “How Sublimation Delays the Onset of Dusty Debris Disk Formation around White Dwarf Stars,” Astrophysical Journal Letters Vol. 913, No. 2 (2021), L31. Abstract / Preprint.
Exotic Ice on Europa?
The first thing to say about the image below is that it fills me with anticipation for the imagery that Europa Clipper will acquire when it travels to the Jovian moon later this decade (arrival in 2030, according to current planning). This is a Galileo image taken in 1996, the subject of intense study, as have been all the Europa images, ever since. How much interaction does Europa’s subsurface ocean have with the icy crust? We can’t say for sure how much is going on now, but images like these show how much fracturing and re-formation there has been in the past. In any event, fresh data from Europa Clipper should give us entirely new insights.
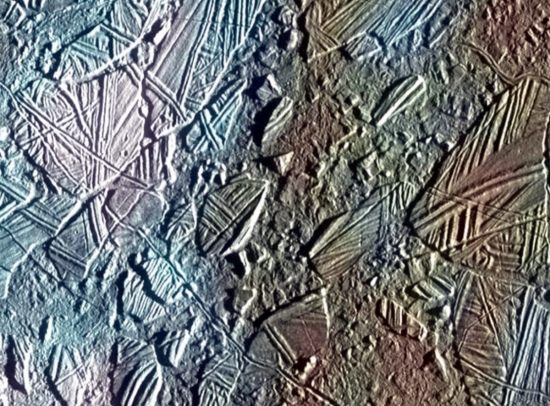
Image: Enhanced image of a small region of the thin, disrupted ice crust on Jupiter’s moon Europa taken in 1996 by NASA’s Galileo spacecraft. Image Source: NASA.
Beyond that, though, there is another story with Europa implications that is being investigated by scientists at Oak Ridge National Laboratory, an installation under the aegis of the U.S. Department of Energy. Because while we can look at the above image and discuss plumes coming up from beneath (and there is some evidence for this), we also have to remember that this may be a different kind of ice than we find occurring on Earth. What we see on Europa and other icy objects in the outer system likely comes under the heading amorphous ice.
The distinction occurs because ice in a cold, hard vacuum shows an atomic structure that is not arranged into a tight crystalline lattice. Somewhere along the line water ice makes a transition between crystalline and amorphous ice phases. Just how this occurs is difficult to observe, but scientists at ORNL, working with colleagues at the Jet Propulsion Laboratory, have been able to lower the temperature of a crystal sapphire plate to 25 K, after which it was placed in a vacuum chamber, where a small number of heavy water molecules (D2O) were added.
The idea was to observe changes in the ice structure with temperature, with plans to simulate outer Solar System conditions by bombarding the sample with electron radiation and charting the effect on the ice structure. Chris Tulk is an ORNL physicist specializing in neutron scattering:
“The experiment produced a layer of amorphous ice similar to the ice that makes up most of the water throughout the universe. This is the same type of ice that could have formed on the extremely cold permanently shadowed regions of the Moon, on the polar regions of Jupiter’s moon Europa, and within the material between the stars in our galaxy, known as dense molecular clouds. Although much of the ice has by now probably crystallized on the warmer bodies, the fresh ice on colder bodies and in deep space is likely still amorphous.”
We know that Europa’s surface is constantly irradiated by charged particles coming off interactions with Jupiter’s intense magnetic field. Just how the ice is changed — and how much of the surface ice turns out to be amorphous — will be factors as we analyze data from Europa Clipper. The laboratory work is also applicable to likely amorphous ices in the Kuiper Belt.
The Spallation Neutrons and Pressure (SNAP) diffractometer at Oak Ridge’s Spallation Neutron Source is the site of these experiments. Here the researchers have configured the instrument to achieve conditions of extreme cold and high radiation like those around Europa. Ahead for the team is to study the changes in amorphous ice as it makes the transition from the crystalline structure, using an instrument called VISION, which performs vibrational spectroscopy, a method that can reveal molecular structure, chemical bonding, and intermolecular interactions.
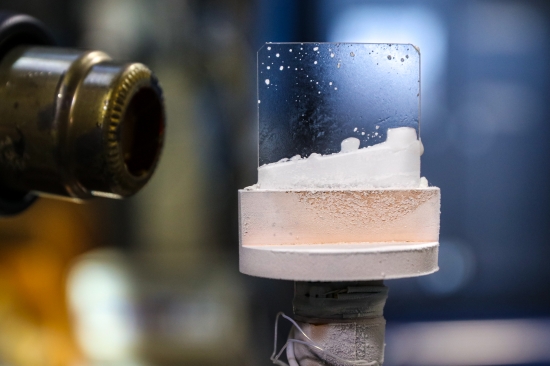
Image: Scientists created this exotic “outer space” ice by freezing a stream of heavy water (D2O) molecules on a sapphire plate that is cooled to about -414° F in a vacuum chamber. Credit: ORNL/Genevieve Martin.
How much of Europa’s surface is made up of amorphous ice? We may soon have a good indication. Murthy Gudipati is a senior research scientist at JPL:
“This information could help us better interpret the science data from the Europa Clipper spacecraft and also provide some clues about how water ice evolves in various parts of the Universe. With a launch date planned for 2024, the goal of the Europa Clipper mission is to assess Europa’s habitability by studying its atmosphere, surface, and interior, including liquid water beneath the icy crust that could potentially support life.”

Follow with RSS or E-Mail
