Centauri Dreams
Imagining and Planning Interstellar Exploration
Speculations on Starless Worlds
Yesterday’s paper from Matt Clement and team reminded us of the enormous transformation that can take place in a planetary system as it lurches toward eventual stability. Gas giants have so much to say about how this process occurs, with their gravitational interactions sometimes ejecting other worlds from the system. Ejected planets are often called ‘rogue’ planets because they wander the galaxy without orbiting a star. Their numbers may be vast.
Clement and team think we may have ejected an ice giant from our early system, as we discussed yesterday. Whatever the case, I’ve been talking about rogue planets for about ten years, and as I look back, I run into intriguing finds like PSO J318.5-22, which is described in a 2013 paper from Michael Liu and colleagues (citation below). Says Liu (University of Hawaii):
“We have never before seen an object free-floating in space that looks like this. It has all the characteristics of young planets found around other stars, but it is drifting out there all alone.”
We learn from the paper that this object shows similarities to young, dusty planets in terms of luminosity, mass, spectrum, etc. It’s also useful because it’s likely a member of the ? Pic moving group, meaning we can glean something about its age, about 12 million years. Have a look.
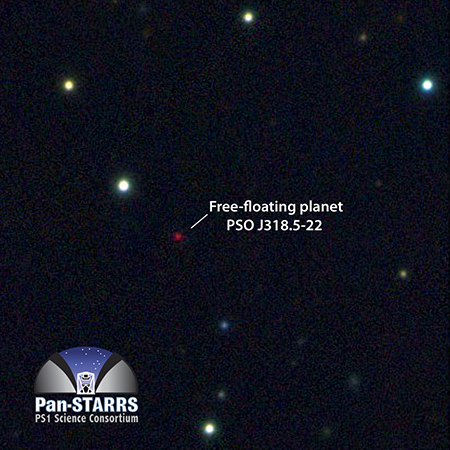
Image: One apparent free-floating planet turned up in a search for brown dwarfs. This multicolor image is from the Pan-STARRS1 telescope, showing PSO J318.5-22, in the constellation of Capricorn. The planet is extremely cold and faint, with most of its energy emitted at infrared wavelengths. The image is 125 arcseconds on a side. Credit: N. Metcalfe & Pan-STARRS 1 Science Consortium.
Estimates of the number of rogue planets are all over the map, with one recent one being 2000 objects ranging in size between the Moon and Jupiter per main sequence star. That’s from a 2018 study by Xinyu Dai & Eduardo Guerras (University of Oklahoma), but if we want to jump to the high end, we can go with Louis Strigari (Stanford University) and colleagues: 105 compact objects per main sequence star. See Island Hopping to the Stars for Strigari, and Detection of Extragalactic Planets? for Dai and Guerras, where I give citations.
Now we have word of a small rogue world probably about the size of the Earth. Przemek Mroz (California Institute of Technology) is lead author of the study. Detected through gravitational microlensing, which is about the only way it could have been found with our current technologies, the world is labelled OGLE-2016-BLG-1928. This is the smallest rogue candidate yet identified, with the microlensing event having a timescale of a scant 42 minutes.
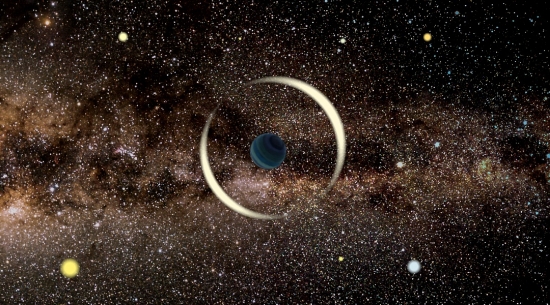
Image: An artist’s impression of a gravitational microlensing event by a free-floating planet. Credit: Jan Skowron / Astronomical Observatory, University of Warsaw.
Gravitational microlensing occurs when a foreground star (or planet, in this case) moves in front of a background stellar object, causing the light from the more distant star to be magnified. A brief burst in magnification becomes the signal identifying the star and any associated exoplanet, but in the case of rogue planets, we have no central star. Here’s Mroz on the matter:
“If a massive object (a star or a planet) passes between an Earth-based observer and a distant source star, its gravity may deflect and focus light from the source. The observer will measure a short brightening of the source star. Chances of observing microlensing are extremely slim because three objects – source, lens, and observer – must be nearly perfectly aligned. If we observed only one source star, we would have to wait almost a million year to see the source being microlensed.”
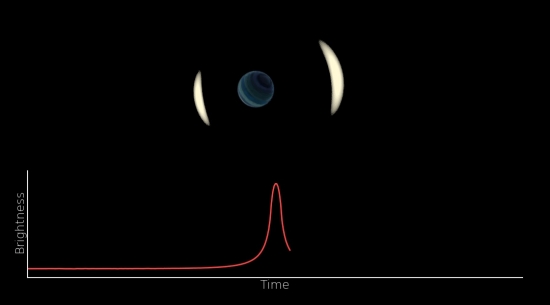
Image: Changes of brightness of the observed star during the gravitational microlensing event by a free-floating planet. Credit: Jan Skowron / Astronomical Observatory, University of Warsaw.
Given how few of these objects we have detected, and the wide range of estimates in the population of rogue planets, it’s hard to make too many statements about them. Are they all the likely result of gravitational interactions in an infant or maturing stellar system? Is there a risk of mistaking ultracool brown dwarfs for planets in this regime (I assume the answer is yes)? In the case of OGLE-2016-BLG-1928, are we absolutely sure there is no host star? Consider this passage from the paper:
The discovery of OGLE-2016-BLG-1928 demonstrates that current microlensing surveys are capable of finding extremely-short-timescale events. Although the mass of the lens cannot be unambiguously measured, properties of the event are consistent with the lens being a sub-Earth-mass object with no stellar companion up to the projected distance of ? 8 au from the planet. Thus, the lens is one of the best candidates for a terrestrial-mass rogue planet detected to date. This population of low-mass free-floating (or wide-orbit) planets may be further explored by the upcoming microlensing experiments.
Would OGLE have detected a star here if the planet in question was at Saturn’s 10 AU distance from it? This was one tricky detection, “at the edge of current limits of detecting short-timescale microlensing events,” according to the authors. It’s suggestive of a rogue planet. Looking ahead, we’re also moving toward a space-based microlensing capability in the Nancy Grace Roman Space Telescope (WFIRST). Future surveys will doubtless turn up rogue planets that will add to the ground-breaking work accomplished by dedicated ground-based surveys like OGLE.
And I wonder: What happened to that third ice giant that was ejected from our early Solar System? Is it out there wandering the galaxy, yet another rogue far from the star of its birth?
The paper is Mroz et al., “A terrestrial-mass rogue planet candidate detected in the shortest-timescale microlensing event,” Astrophysical Journal Letters Vol. 903, No. 1 (29 October 2020). Abstract / Preprint. The Liu paper is “The Extremely Red, Young L Dwarf PSO J318-22: A Free-Floating Planetary-Mass Analog to Directly Imaged Young Gas-Giant Planets,” Astrophysical Journal Letters Vol. 77, No. 2 (22 October 2013). Abstract.

Jupiter, Saturn and the Early Solar System
The days when scientists assumed our Solar System would be something of a template for planetary systems elsewhere are long past. The issue now is to delve deeper into system architectures to figure out what happens in their infancy and how they evolve. Working backward from today’s Solar System is one way to approach the problem. Thus Matt Clement (Carnegie Institution for Science), who has led a recent study into the formation of Jupiter and Saturn, hoping to determine how they wound up in their present orbits. Says Clement:
“We now know that there are thousands of planetary systems in our Milky Way galaxy alone. But it turns out that the arrangement of planets in our own Solar System is highly unusual, so we are using models to reverse engineer and replicate its formative processes. This is a bit like trying to figure out what happened in a car crash after the fact–how fast were the cars going, in what directions, and so on.”
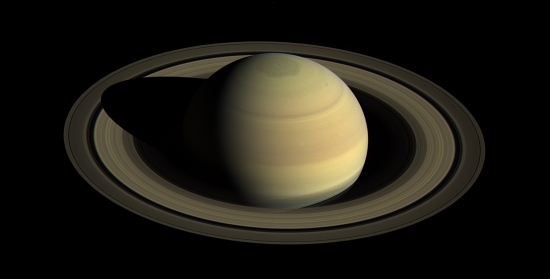
Image: New work led by Carnegie’s Matt Clement reveals the likely original locations of Saturn and Jupiter. Credit: Saturn image is courtesy of NASA/JPL-Caltech/Space Science Institute.
As you would imagine, work like this involves numerous computer simulations, some 6,000 of which are described in the paper in Icarus. The Solar System we were born into emerges in these simulations from conditions that were markedly dissimilar in the early days of planet formation, when the larger bodies in the system began to spring gravitational surprises on a tidy early arrangement, with a re-shuffling that gave shape to today’s orbital stability.
Our models for how all this happened are now being tweaked, as exemplified by Clement and team’s work. Whereas Jupiter was once believed to orbit the Sun three times for every two orbits completed by Saturn — this has evolved within the ‘Nice Model’ of system formation — the new computer simulations show that the arrangement of planets we have today is better produced by starting with a ratio of two Jupiter orbits to one Saturn orbit.
As the authors put it, “adequately exciting Jupiter’s eccentricity without exceeding Jupiter and Saturn’s modern orbital spacing is extremely challenging.” The Nice Model (named after the city in France, where it was originally developed at the Observatoire de la Côte d’Azur) considers the migration of the giant planets after the dissipation of the early protoplanetary disk. Clement’s simulations show the effect of the Kuiper Belt on the positions of Uranus and Neptune, with signs of an early ice giant that was ejected during the roiling period of system formation.
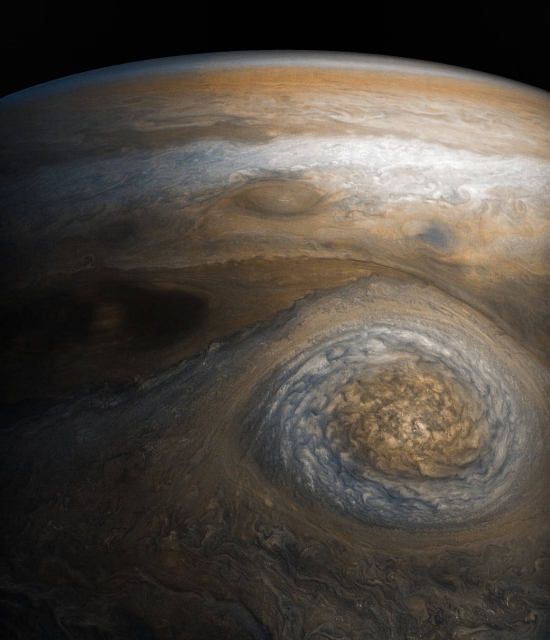
Image: Jupiter in its infancy was thought to orbit the Sun three times for every two orbits that Saturn completed. But this arrangement is not able to satisfactorily explain the configuration of the giant planets that we see today. Matt Clement and his co-authors showed that a ratio of two Jupiter orbits to one Saturnian orbit more consistently produced results that look like our familiar planetary architecture. Credit: NASA.
In the Nice Model, the planets emerge from the protoplanetary disk in a compact, resonant configuration, with subsequent perturbations breaking the resonance of one or more planets, creating a phase of dynamical instability that reshapes the outer Solar System. The Nice Model is widely accepted in the field because of its ability to predict the orbital shape of the Kuiper Belt and main asteroid belt, and properties of some gas giant moons.
The Nice Model seems strong, and as the paper points out, its simulations replicate the capture of irregular moons in the outer Solar System and allow the survival of the asteroid belt while explaining the trojan asteroids. As the authors go on to say, “A major potential pitfall of the primordial 2:1 version of the Nice Model presented in this manuscript is its effects on the asteroid belt and terrestrial-forming regions.”
Hence the need to investigate the consequences of the proposed scenario on the inner Solar System. But the paper discusses the problems resolved by assuming an initial 2:1 resonance. The authors acknowledge that some aspects of the system’s present architecture are still low-probability outcomes. A major issue is eccentricity. Were the gas giants actually born in a 2:1 resonance and in orbits that were at origin somewhat eccentric?
That scenario, described as “somewhat of a paradigm shift,” does produce the modern Jupiter-Saturn orbits and is consistent with the position of Uranus and Neptune, with this addition: “…we show that Uranus and Neptune’s final orbits are determined by a combination of the mass in the primordial Kuiper belt and that of an ejected ice giant.” Adds Clement:
“This indicates that while our Solar System is a bit of an oddball, it wasn’t always the case. What’s more, now that we’ve established the effectiveness of this model, we can use it to help us look at the formation of the terrestrial planets, including our own, and to perhaps inform our ability to look for similar systems elsewhere that could have the potential to host life.”
As we tighten the Nice Model further, the paper describes the research path ahead:
Though our work shows that the primordial 2:1 Jupiter-Saturn resonance is a viable evolutionary path for the solar system, future work is still required to fully validate our presumed initial conditions, and robustly analyze the consequences of such a scenario on the solar system’s fragile populations of small bodies. In particular, follow-on investigation of the giant planets’ instability evolution with Jupiter and Saturn in a primordial 2:1 MMR with enhanced eccentricities must consider longer integration times (≲100 Myr), higher resolution disks (≲10,000 particles), and account for the dissipating gaseous nebula.
Clement presented these results at the American Astronomical Society’s Division for Planetary Sciences virtual meeting, which ended on the 30th of October.
The paper is Clement et al., “Born eccentric: Constraints on Jupiter and Saturn’s pre-instability orbits,” Icarus Vol. 355 (February 2021), 114122 (abstract).

Getting Ready for Dragonfly: Titan’s Impact Craters
What accounts for the differences in Titan’s craters? It will be helpful from an operational standpoint to learn more, for in 2027 the Dragonfly mission will launch, with Selk Crater a target. An equatorial dune crater, Selk is completely covered in a dark organic material, unlike other higher-latitude craters on the Saturnian moon that are scoured and cleansed by rain. We have learned from data produced by Cassini’s Visible and Infrared Mapping Spectrometer (VIMS) that Titan’s craters come in two kinds. Equatorial craters like Selk occur in dune fields and consist mostly of organics. Mid-latitude craters show a mix of organics and water ice.
The organic material generated by processes in Titan’s thick atmosphere is sand-like, piling up in equatorial regions but being eroded at the higher, wetter latitudes. For Dragonfly’s purposes, we want to know more about how the methane rain and streams affect the surface as we fine-tune the data analysis and monitoring techniques to be used in the mission.
What’s happening in Titan’s craters reminds us just how active the surface here is, says Anezina Solomonidou, a research fellow at the European Space Agency and lead author of a paper that explores the issue:
“The most exciting part of our results is that we found evidence of Titan’s dynamic surface hidden in the craters, which has allowed us to infer one of the most complete stories of Titan’s surface evolution scenario to date. Our analysis offers more evidence that Titan remains a dynamic world in the present day.”

Image: This composite image shows an infrared view of Saturn’s moon Titan from NASA’s Cassini spacecraft, acquired during the mission’s “T-114” flyby on Nov. 13, 2015. The spacecraft’s visual and infrared mapping spectrometer (VIMS) instrument made these observations, in which blue represents wavelengths centered at 1.3 microns, green represents 2.0 microns, and red represents 5.0 microns. A view at visible wavelengths (centered around 0.5 microns) would show only Titan’s hazy atmosphere. The near-infrared wavelengths in this image allow Cassini’s vision to penetrate the haze and reveal the moon’s surface. Credit: NASA/JPL/University of Arizona/University of Idaho.
Look closely at the above image and you’ll see Titan’s largest confirmed impact crater, called Menrva, near the limb above center to the left. Cassini was at about 10,000 kilometers from the moon during this approach, a good deal higher than many flybys, but the altitude allowed the VIMS instrument to cover wide areas at moderate resolution. You can also see two dark bands, parallel regions filled with dunes at the center of the image, with some regions of finer resolution inset in the image; these were acquired near the spacecraft’s closest approach.
But back to the evolution of those craters, which is the subject of the paper in Astronomy & Astrophysics. The differences between craters are telling, for they point to different evolution depending on geography. When objects make it through Titan’s atmosphere to impact on the surface, the heat generated by the event mixes organic materials and water ice from below. The cleansing methane rain subsequently falls in the mid-latitude plains, whereas in the equatorial regions, the impact areas are covered by a layer of sandy organic sediment.
The two classes of impact crater are strikingly different. Processes after the impact account for the outcomes. From the paper:
These observations agree with the evolution scenario proposed by Werynski et al. (2019), wherein the impact cratering process produces a mixture of organic material and water ice, which is later “cleaned” through fluvial erosion in the mid-latitude plains. However, the cleaning process does not appear to operate in the equatorial dunes; rather, the dune craters are quickly covered by a thin layer of sand sediment. This scenario agrees with other works that suggest that atmospheric deposition is similar in the low-latitudes and midlatitudes on Titan, but with more rain falling onto the higher latitudes causing additional processing of materials in those regions… In either case, it appears that active processes are working to shape the surface of Titan, and it remains a dynamic world in the present day.
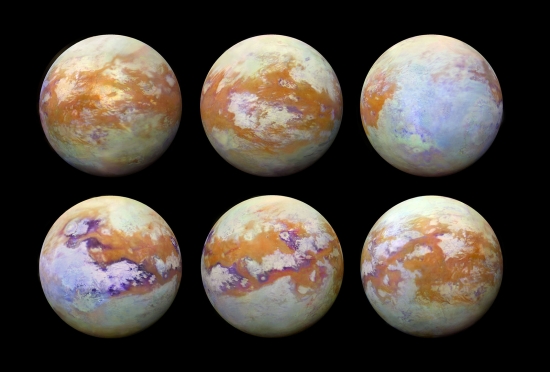
Image: These six infrared images of Saturn’s moon Titan represent some of the clearest, most seamless-looking global views of the icy moon’s surface produced so far. The views were created using 13 years of data acquired by the Visual and Infrared Mapping Spectrometer (VIMS) instrument on board NASA’s Cassini spacecraft. Credit: NASA/JPL-Caltech/Stéphane Le Mouélic, University of Nantes, Virginia Pasek, University of Arizona.
With a sea of water and ammonia beneath the crust, Titan is a place where a large impact will move organic materials between the surface and the ocean below, highlighting the significance of Dragonfly’s future work at Selk Crater as a way to probe the moon’s composition. And while it seems likely that erosion has obscured most impact craters from Titan’s past, we do have 90 potential features, according to the paper, that may be craters to work with. These features offer a window into the atmosphere’s influence on the surface through weathering while exposing material from the interior which Cassini’s RADAR instrument was unable to probe.
The paper is Solomonidou et al., “The chemical composition of impact craters on Titan,” Astronomy & Astrophysics Vol. 641, A16 (September 2020). Abstract.
The Galactic Bulge: A Single Burst of Star Formation?
Discussions of the Milky Way’s center have always attracted me. Here we find ancient stars, with all that suggests about the possibility of long-lived civilizations, but occurring in a place where ionizing radiation associated with the galaxy’s supermassive black hole (Sagittarius A*) may push the habitable regions out into the galactic suburbs. And then there are all those supernovae to contend with! Maybe life in these parts is, if present, single-celled, perhaps underwater, with brief land colonization before new extinction events erase it.
Whatever the case, I’m learning that the galaxy’s central bulge is inspiring a new wave of study. A survey of millions of stars there is producing insights into how the bulge originally formed. We can look at spiral galaxies near and far and find commonality in their central bulge of stars surrounded by the familiar disk, but if the bulge stars formed in a single burst of activity, we could be seeing a population as old as 10 billion years in our home galaxy. But it has also been argued that waves of star formation have occurred in the bulge, so that some stars there may constitute a population as relatively ‘young’ as three billion years, younger than the Sun.
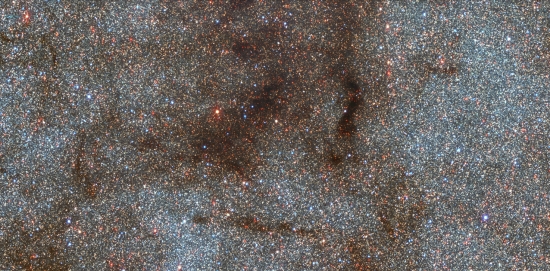
Image: This photo looking toward the center of the Milky Way galaxy covers 0.5 by 0.25 degrees on the sky and contains over 180,000 stars. The image captures a portion of our galaxy about 220 by 110 light-years across. It was taken with the Dark Energy Camera on the Victor M. Blanco 4-meter Telescope at the Cerro-Tololo Inter-American Observatory in Chile, a Program of NSF’s NOIRLab. Credit: CTIO/NOIRLab/NSF/AURA/STScI, W. Clarkson (UM-Dearborn), C. Johnson (STScI), and M. Rich (UCLA).
The new study begins to untangle the contrasting theories of bulge star formation. It is in the hands of co-principal investigators Christian Johnson (Space Telescope Science Institute) and Michael Rich (UCLA), who used the wide-field Dark Energy Camera (DECam) on the 4-meter Victor M. Blanco instrument at Cerro Tololo in Chile to capture 3 square degrees of sky with each exposure. 250 million stars fall into the field of these observations. All told, more than 450,000 photographs have been produced and the chemical compositions of over 70,000 stars analyzed, as described in two papers on this work. Johnson describes the study:
“Our survey is unique because we were able to scan a continuous section of the bulge at wavelengths of light from ultraviolet to visible to near-infrared. That allows us to get a clear understanding of what the various components of the bulge are and how they fit together.”
What Johnson and Rich find is that most stars in the central 1,000 light years of the galaxy’s hub formed more than 10 billion years ago, perhaps triggered by a merger with another galaxy in formation, or else through accretion of infalling gas and dust. The work proceeded by analyzing the stars’ chemical compositions, which produced interesting results. Stars in this region have roughly the same metallicity (elements higher than hydrogen and helium) as the Sun. In other words, these ancient stars are somehow enriched in metals. Here’s Rich:
“Something different happened in the bulge. The metals there built up very, very quickly, possibly in the first 500 million years of its existence.”
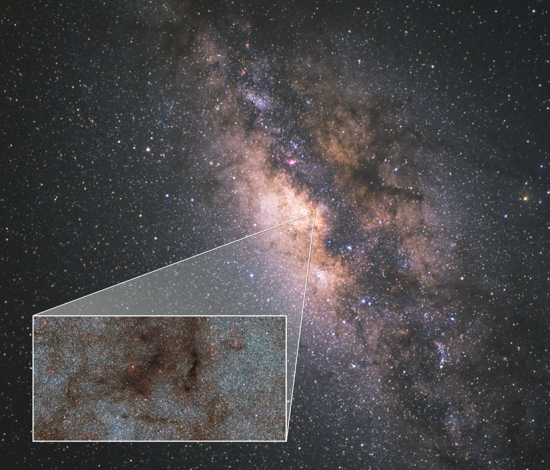
Image: This image shows a wide-field view of the center of the Milky Way with a pull-out image taken by the Dark Energy Camera (DECam) at the Cerro-Tololo Inter-American Observatory in Chile. Credit: Milky Way photo: Akira Fujii; Inset photo: CTIO/NOIRLab/NSF/AURA/STScI, W. Clarkson (UM-Dearborn), C. Johnson (STScI), and M. Rich (UCLA).
Measuring stellar brightness at different wavelengths — near-ultraviolet, optical, and near-infrared — is the key to the researchers’ method, with the ultraviolet data taking precedence. Differences in brightness depending on wavelength define photometric colors, which can be used to reveal the composition of stars when the data are calibrated against spectroscopic measurements. Stars forming at different times, we would expect, would show different levels of metallicity, but in this 1,000 light-year region, the distribution of metals is similar. Theories suggesting multiple phases of star formation over billions of years seem ruled out. From the paper:
…little physical motivation exists regarding why the bulge should be a composite of two or more populations that each have a relatively narrow, normally distributed metallicity distribution function. Systems composed of two or more populations with narrow, normally distributed metallicity distributions do exist in nature, but such objects often show extreme heavy element abundance variations that are indicative of a prolonged period of ‘bursty’ star formation and self-enrichment, particularly from low- and intermediate-mass AGB stars (e.g. ω Cen; Johnson & Pilachowski 2010; Marino et al. 2011b). The Galactic bulge shows no evidence supporting this type of enrichment pattern.
The stars analyzed in this region of the galactic bulge are enriched in metals despite their age, with a distribution of metals clustered around a single average. We seem to be looking at a single burst of star formation here. The full dataset for the Blanco DECam Bulge Survey will soon be released, offering a major resource for those investigating stellar populations within the inner disk and the galactic bulge that will be useful when combined with other imaging surveys. Up next for the authors is research into any correlations between metallicity and stellar orbits, which could uncover the remains of dwarf galaxies disrupted in this ancient phase of star formation.
The papers are Johnson et al., “Blanco DECam Bulge Survey (BDBS) II: project performance, data analysis, and early science results,” Monthly Notices of the Royal Astronomical Society 499 (3 September 2020), 2357-2379 (full text); and Rich et al., “The Blanco DECam bulge survey. I. The survey description and early results,” Monthly Notices of the Royal Astronomical Society 499 (3 September 2020), 2340-2356 (full text).
Short Takes on Events in ‘Local’ Space
You wouldn’t think that a place 100 times drier than the Sahara desert would have a lot to offer, but when that place is the sunlit surface of the Moon, the import of the new discovery from the SOFIA airborne observatory is clear. H2O in Clavius Crater, in concentrations of 100 to 412 parts per million, is said by NASA to be equivalent to a 12-ounce bottle of water trapped in a cubic meter of soil spread across the lunar surface. The results in Nature Astronomy point to interesting possibilities for future missions if the water is accessible.
Exactly what would be involved in extracting such a resource? While we try to figure that out, where the water comes from is an interesting question. Thus Casey Honniball (NASA GSFC), lead author on the SOFIA paper:
“Without a thick atmosphere, water on the sunlit lunar surface should just be lost to space. Yet somehow we’re seeing it. Something is generating the water, and something must be trapping it there.”
We also have Paul Hayne and team’s work using the Lunar Reconnaissance Orbiter to map shadowed regions, the ‘cold traps’ once thought restricted to deep craters. But micro-traps also seem to be in play, meters across and even less. The Hayne estimate is that cold traps may occupy 40,000 square kilometers, about 0.1 per cent of the moon’s surface. Between the two studies, we have reason to be energized about future human operations on the Moon.
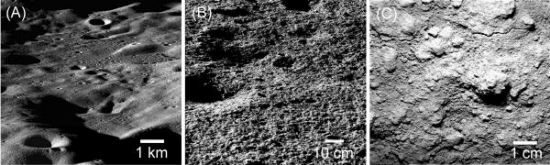
Image: These three images of the lunar surface show shadows at all scales, from several kilometers to less than a centimeter. (A) Lunar Reconnaissance Orbiter oblique view over the rim of the Cabeus crater near the Moon’s south pole (NASA/GSFC/ASU). (B) Chang’e-3 close-up surface image taken by the Yutu rover some distance from the landing site (CNSA/CLEP). (C) Apollo 14 close-up camera image of undisturbed regolith. Some of these shadows are permanent and could remain cold enough to harbor ice. Credit: NASA.
Oded Aharonson (PSI) is a co-author on the Hayne paper:
“I think the way this changes our perspective of water on the Moon is that until now, our efforts were focused on the largest reservoirs situated within the broadest and deepest craters at high latitudes. But we now understand that we expect a large number of much smaller reservoirs of water. The smaller deposits should be more accessible for at least two reasons: the distance to the nearest one from a hypothetical landing site might be shorter; and the deposit would not be surrounded by imposing tall crater rims, but rather much gentler slopes.”
The papers in play here are Honnibal et al., “Molecular Water Detected on the Sunlit Moon by SOFIA,” Nature Astronomy 26 October 2020 (abstract); and Hayne et al., “Micro Cold Traps on the Moon,” Nature Astronomy 26 October 2020 (abstract).
The more lunar water we can use in future missions, the less we have to take with us. And speaking of taking things with us, let’s look again at OSIRIS-REx and the disposition of its sample from asteroid Bennu. In a day of quick follow-ups, I also want to take a look at Jupiter’s upper atmosphere and a recent find uncovered in a study of four years of Juno data.
What OSIRIS-REx Does Next
An ‘early stow’ is what NASA calls the operation that will protect the precious sample of surface material from asteroid Bennu that was collected just recently by the OSIRIS-REx spacecraft. The goal was to collect about 60 grams and the spacecraft managed more than that, enough so that the collector head was found to be overflowing with Bennu’s regolith. The problem: Some of the particles, as seen in images from the spacecraft, have been escaping from the collector (properly speaking, the Touch-And-Go Sample Acquisition Mechanism, or TAGSAM).
As you would imagine, TAGSAM is supposed to seal back up once the surface material is inside, with a mylar flap safely containing the material, but it became clear that some rocks had wedged the flap open, which explains the leakage. Given the size of the sample despite minor losses, the stowage was re-scheduled, moving it up from November 2, with the materials to be moved to the OSIRIS-REx Sample Return Capsule (SRC). Multiple days are involved in all this, including new imaging and a careful check of the collector head’s placement in the SRC.
The OSIRIS-REx team is working with a light delay of 18.5 minutes each way, all the while trying to monitor the wrist alignment on TAGSAM to manage proper placement of the collector head. Says Dante Lauretta, OSIRIS-REx principal investigator at the University of Arizona, Tucson:
“The abundance of material we collected from Bennu made it possible to expedite our decision to stow. The team is now working around the clock to accelerate the stowage timeline, so that we can protect as much of this material as possible for return to Earth.”
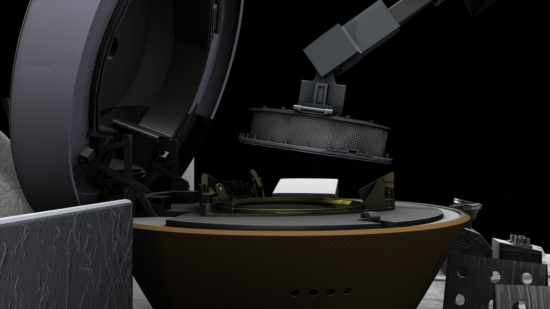
Image; This illustration shows NASA’s OSIRIS-REx spacecraft stowing the sample it collected from asteroid Bennu on Oct. 20, 2020. The spacecraft will use its Touch-And-Go Sample Acquisition Mechanism (TAGSAM) arm to place the TAGSAM collector head into the Sample Return Capsule (SRC).
Credits: NASA/University of Arizona, Tucson
‘Sprites’ in Jupiter’s Upper Atmosphere
A lot is going on in ‘local’ space (meaning in this site’s parlance, within the Solar System), and I haven’t even mentioned the competing papers on Venusian phosphine today. I can also throw in the Mars 2020 Perseverance rover, which has just reached the halfway point on its journey to Mars, at this writing about 235 million kilometers out, with arrival on February 18, 2021. Now we get word from Juno, NASA’s ongoing Jupiter mission, involving the detection of transient events in the huge world’s upper atmosphere, which the space agency is referring to as ‘sprites.’
We can also call them ‘transient luminous events,’ or TLE’s in the acronym-rich milieu of aerospace, and they come in several forms, including ‘elves’ (Emission of Light and Very Low Frequency perturbations due to Electromagnetic Pulse Sources) and ‘sprite halos.’ The data come from Juno’s ultraviolet spectrograph instrument (UVS), which detected in 2019 the narrow streak of ultraviolet in question. UVS is primarily used to image Jupiter’s northern and southern auroras. Rohini S. Giles (SwRI) is lead author of the paper describing the flashes, which is in process at the Journal of Geophysical Research: Planets:
“UVS was designed to characterize Jupiter’s beautiful northern and southern lights. But we discovered UVS images that not only showed Jovian aurora, but also a bright flash of UV light over in the corner where it wasn’t supposed to be. The more our team looked into it, the more we realized Juno may have detected a TLE on Jupiter.”

Image: This illustration shows what a sprite could look like in Jupiter’s atmosphere. Named after a mischievous, quick-witted character in English folklore, sprites last for only a few milliseconds. They feature a central blob of light with long tendrils of light extending down toward the ground and upward. In Earth’s upper atmosphere, their interaction with nitrogen give sprites a reddish hue. At Jupiter, where the predominance of hydrogen in the upper atmosphere would likely give them a blue hue. Credit: NASA/JPL-Caltech/SwRI.
Eleven bright events of this nature have now been found in the Juno data, occurring in a region where lightning from storms is common, but located some 300 kilometers above the water-cloud area where most of Jupiter’s lightning forms. The spectra recorded by the UVS is dominated by hydrogen emissions. As the paper notes, the three types of TLE occur on Earth:
…in response to tropospheric lightning strikes. This is supported by visible light imaging, which shows cloud features typical of lightning source regions at the locations of several of the bright flashes. TLEs have previously only been observed on Earth, although theoretical and experimental work has predicted that they should also be present on Jupiter.
With a second source of TLEs off our planet, we’ll have a new tool for investigating electrical activity in planetary atmospheres.
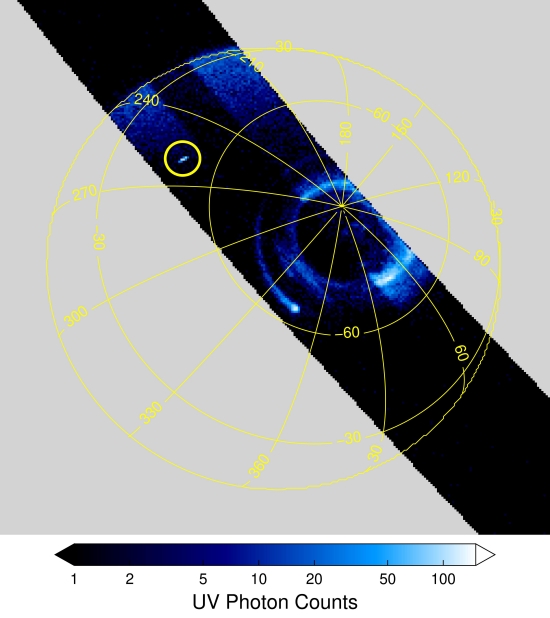
Image: The south pole of Jupiter is seen in this annotated image of data from the ultraviolet spectrograph (UVS) instrument aboard NASA’s Juno spacecraft. Bands of bright white and blue near the south pole are Jupiter’s southern aurora. But researchers also noticed an unusual bright flash of light well away from the auroral region, highlighted here by the yellow circle at about the 10 o’clock position (between longitudinal lines 270 and 240). Juno scientists believe it could be an indication of a bright, unpredictable, and extremely brief flash of light — known as a transient luminous event — that was triggered by lightning discharges from thunderstorms far below. The data for this UVS image was acquired on April 10, 2020. Credit: NASA/JPL-Caltech/SwRI.
The paper is Giles et al., “Possible Transient Luminous Events observed in Jupiter’s upper atmosphere,” accepted at the Journal of Geophysical Research: Planets 27 October 2020 (abstract).
Probing an Unusual ‘Hot Neptune’
Scientists have created the first global temperature map for a planet discovered by TESS, a ‘hot Neptune’ known as LTT 9779b. The first of two just released papers also notes that this is the first spectral atmospheric characterization of a TESS planet. That makes this unusual discovery (lead author Ian Crossfield calls it a “planet that shouldn’t exist”) a useful test case for future work, because the goal of finding the biosignatures of living worlds won’t be achieved without drilling down from inhospitable places like LTT 9779b. The atmospheres of hotter, larger and more readily characterizable planets let us hone our techniques and teach us how to proceed.
Crossfield’s reference to the planet’s rarity draws on the fact that so few worlds like this occur close to their host stars, probably because their mass is low enough that the proximity to the star causes atmospheric evaporation. A larger gas giant like one of the ‘hot Jupiters’ we began finding in the beginning of the exoplanet hunt can hang on to an atmosphere in breathtaking proximity to its star, but a smaller world might lose its gases and become an airless rocky place.

In an email yesterday, Dr. Crossfield (University of Kansas) put his work on this world in context:
What surprised us the most about LTT9779b is that this planet’s atmosphere seems quite different from those of bigger gas giants. A main theory nowadays is that for transiting planets, temperature is the single most important factor in determining the composition & structure of a planet’s atmosphere. But although our hot Neptune is the same temperature as many of the big “hot Jupiters” that have been studied before, its atmosphere looks quite different. LTT 9779b is the first really hot Neptune with a measured atmospheric spectrum and phase curve. We hope it will be the prototype for studying these kinds of objects with the upcoming James Webb Space Telescope. But if there’s one thing we’ve learned, it’s that new exoplanets always find ways to surprise us.
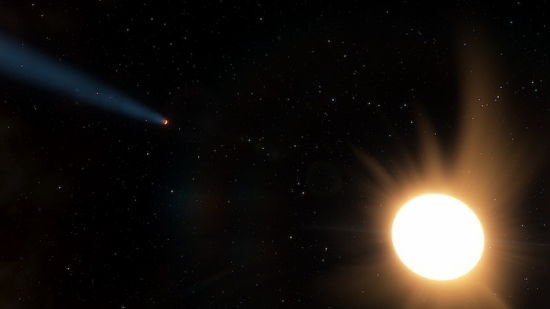
Image: This artist’s impression shows the LTT 9779 system approximately to scale, with the hot Neptune-sized planet at left and its bright, nearby star at right. The trail of material streaming off of the planet is hypothetical but likely, based on the intense irradiation of this planet. Credit: Ethen Schmidt | University of Kansas.
So what does LTT 9779b have to teach us? Crossfield and colleagues show us a planet so close to its star that it reaches temperatures in the range of 1650?. Working with Spitzer data, the team used phase curve analysis to learn about the atmosphere. The object’s phase curve describes its brightness in relation to its phase angle, with the scientists measuring infrared light as the planet rotated 360 degrees on its axis. In a KU news release, Crossfield added:
“Infrared light tells you the temperature of something and where the hotter and cooler parts of this planet are — on Earth, it’s not hottest at noon; it’s hottest a couple of hours into the afternoon. But on this planet, it’s actually hottest just about at noon. We see most of the infrared light coming from the part of the planet when its star is straight overhead and a lot less from other parts of the planet.”
A bit more on this method: The fraction of light reflected off a transiting planet changes during its orbit depending on the planet’s position with regard to the star, as shown in the image below. Untangling this information gives us a way to examine heat transport from the day side to the night side. Phase curve analysis can be used to infer the presence of clouds and even to extract data on their composition. Such analysis has been performed for hot Jupiters, but as the Crossfield et al. paper points out, the work on LTT 9779b takes us into new territory, for “no infrared phase curve data exist for any similar planet (i..e, within a factor of three of LTT 9779b’s mass and a factor of two of its temperature).”
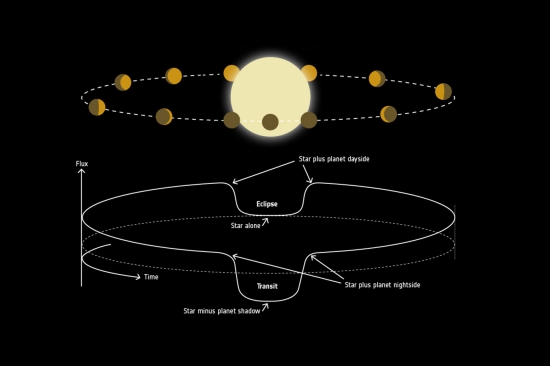
Image: The phase curve method to study extrasolar planets. Depending on a planet’s position with respect to its host star, the total light collected by a telescope will include a varying fraction of light reflected off the planet, in a similar manner to how we experience the phases of the Moon. The planet reflects no light during a phase known as secondary eclipse, when it is hidden from view, whereas it reflects some light shortly before and after this phase. In addition to that, the planet blocks a fraction of the light as it transits in front of the star. Credit: ESA.
Lead would melt in the atmosphere of LTT 9779b, and so, as Crossfield notes, would platinum, chromium and stainless steel in an environment where the day is less than 24 hours long. Co-author Nicolas Cowan (Institute for Research on Exoplanets and McGill University) was involved in the interpretation of the thermal phase curve measurements:
“The planet is much cooler than we expected, which suggests that it is reflecting away much of the incident starlight that hits it, presumably due to dayside clouds. The planet also doesn’t transport much heat to its nightside, but we think we understand that: The starlight that is absorbed is likely absorbed high in the atmosphere, from whence the energy is quickly radiated back to space.”
The data show spectral absorption features indicating carbon monoxide and/or carbon dioxide. This information, along with the global temperature map that emerges from the phase curve data, allows deductions about atmospheric circulation. A second paper on the planet investigates the atmosphere through secondary eclipse observations. The lead author of the second paper is Diana Dragomir (University of New Mexico), with Crossfield as co-author (citations below).
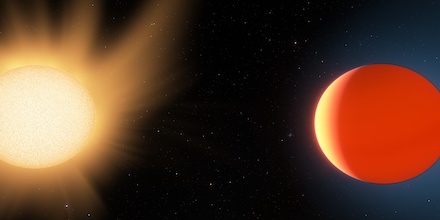
Image: This artist’s impression shows LTT 9779b near the star it orbits, and highlights the planet’s ultra-hot (2000 Kelvin) day-side and its quite-toasty night-side (around 1000 K). Credit: Ethen Schmidt | University of Kansas.
With the primary two-year TESS mission close to completion, we will wind up with 85 percent of the sky surveyed for planets transiting nearby stars. LTT 9779b stands out among the planets thus far surveyed, as the Crossfield et al. paper notes in its conclusion:
LTT 9779b remains one of the best targets of its type – i.e., among highly irradiated hot Neptunes that are highly favorable for thermal emission measurements – and so it is likely to remain one of the most easily-characterizable exoplanets in its class. Future phase curve and eclipse observations of LTT 9779b and other similar planets will provide the impetus for the next generation of global circulation modeling of Neptune-size planets, supporting similar observations of many such objects with JWST, ARIEL, and future observatories.
There is much to probe here, including firming up why comparatively little heat is transported to the night side from the hellish day. The strength of the signal here is a key advantage, making the world an excellent shake-out of the techniques we’ll one day use to probe the atmospheres of smaller worlds in search of biosignatures.
The paper is Crossfield et al., “Phase Curves of Hot Neptune LTT 9779b Suggest a High-metallicity Atmosphere,” Astrophysical Journal Letters Vol. 903, No. 1 (26 October 2020). Abstract available. The Dragomir et al. paper is “Spitzer Reveals Evidence of Molecular Absorption in the Atmosphere of the Hot Neptune LTT 9779b,” Astrophysical Journal Letters Vol. 903, No. 1 (26 October 2020). Abstract.

Follow with RSS or E-Mail
