Centauri Dreams
Imagining and Planning Interstellar Exploration
Breakthrough Propulsion Study
Ideas on interstellar propulsion are legion, from fusion drives to antimatter engines, beamed lightsails and deep space ramjets, not to mention Orion-class fusion-bomb devices. We’re starting to experiment with sails, though beaming energy to a space sail is still an unrealized, though near-term, project. But given the sheer range of concepts out there and the fact that almost all are at the earliest stages of research, how do we prioritize our work so as to move toward a true interstellar capability? Marc Millis, former head of NASA’s Breakthrough Propulsion Physics project and founder of the Tau Zero Foundation, has been delving into the question in new work for NASA. In the essay below, Marc describes a developing methodology for making decisions and allocating resources wisely.
by Marc G Millis

In February 2017, NASA awarded a grant to the Tau Zero Foundation to compare propulsion options for interstellar flight. To be clear, this is not about picking a mission and its technology – a common misconception – but rather about identifying which research paths might have the most leverage for increasing NASA’s ability to travel farther, faster, and with more capability.
The first report was completed in June 2018 and is now available on the NASA Technical Report Server, entitled “Breakthrough Propulsion Study: Assessing Interstellar Flight Challenges and Prospects.” (4MB file at: http://hdl.handle.net/2060/20180006480).
This report is about how to compare the diverse propulsion options in an equitable, revealing manner. Future plans include creating a database of the key aspects and issues of those options. Thereafter comparisons can be run to determine which of their research paths might be the most impactive and under what circumstances.
This study does not address technologies that are on the verge of fruition, like those being considered for a probe to reach 1000 AU with a 50 year flight time. Instead, this study is about the advancements needed to reach exoplanets, where the nearest is 270 times farther (Proxima Centauri b). These more ambitious concepts span different operating principles and levels of technological maturity, and their original mission assumptions are so different that equitable comparisons have been impossible.
Furthermore, all of these concepts require significant additional research before their performance predictions are ready for traditional trade studies. Right now their values are more akin to goals than specifications.
To make fair comparisons that are consistent with the varied and provisional information, the following tactics are used: (1) all propulsion concepts will be compared to the same mission profiles in addition to their original mission context; (2) the performance of the disparate propulsion methods will be quantified using common, fundamental measures; (3) the analysis methods will be consistent with fidelity of the data; and (4) the figures of merit by which concepts will be judged will finally be explicit.
Regarding the figures of merit – this was one of the least specified details of prior interstellar studies. It is easy to understand why there are so many differing opinions about which concept is “best” when there are no common criteria with which to measure goodness. The criteria now include quantifiable factors spanning: (1) the value of the mission, (2) the time to complete the mission, and (3) the cost of the mission.
The value of a mission includes subjective criteria and objective values. The intent is to allow the subjective factors to be variables so that the user can see how their interests affect which technologies appear more valuable. One of those subjective judgments is the importance of the destination. For example, some might think that Proxima Centauri b is less interesting than the ‘Oumuamua object. Another subjective factor is motive. The prior dominant – and often implicit – figure of merit was “who can get there first.” While that has merit, it can only happen once. The full suite of motives continue beyond that first event, including gathering science about the destinations, accelerating technological progress, and ultimately, ensuring the survival of humanity.
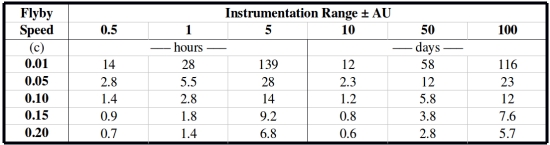
Examples of the objective factors include: (1) time within range of target; (2) closeness to target (better data fidelity); and (3) the amount of data acquired. A mission that gets closer to the destination, stays there longer, and sends back more data, is more valuable. Virtually all mission concepts have been limited to fly-by’s. Table 1 shows how long a probe would be within different ranges for different fly-by speeds. To shift attention toward improving capabilities, the added value (and difficulty) of slowing at the destination – and even entering orbit – will now be part of the comparisons.
Table 1: Time on target for different fly by speeds and instrumentation ranges
Quantifying the time to complete a mission involves more than just travel time. Now, instead of the completion point being when the probe arrives, it is defined as when its data arrive back at Earth. This shift is because the time needed to send the data back has a greater impact than often realized. For example, even though Breakthrough StarShot aims to get there the quickest, in just 22 years, that comes at the expense of making the spacecraft so small that it takes an additional 20 years to finish transmitting the data. Hence, the time from launch to data return is about a half century, comparable to other concepts (46 yrs = 22 trip + 4 signal + 20 to transmit data). The tradeoffs of using a larger payload with a faster data rate, but longer transit time, will be considered.
Regarding the total time to complete the mission, the beginning point is now. The analysis includes considerations for the remaining research and the subsequent work to design and build the mission hardware. Further, the mission hardware, now by definition, includes its infrastructure. While the 1000 AU precursor missions do not need new infrastructure, most everything beyond that will.
Recall that the laser lightsail concepts of Robert Forward required a 26 TW laser, firing through a 1,000 km diameter Fresnel lens placed beyond Saturn (around 10 AU), aimed at a 1,000 km diameter sail with a mass of 800 Tonnes. Project Daedalus envisioned needing 50,000 tonnes of helium 3 mined from the atmospheres of the gas giant planets. This not only requires the infrastructure for mining those propellants, but also processing and transporting that propellant to the assembly area of the spacecraft. Even the more modest Earth-based infrastructure of StarShot is beyond precedent. StarShot will require one million synchronized 100 kW lasers spread over an area of 1 km2 to get it up to the required 100 GW.
While predicting these durations in the absolute sense is dubious (predicting what year concept A might be ready), it is easier to make relative predictions (if concept A will be ready before B) by applying the same predictive models to all concepts. For example, the infrastructure rates are considered proportional to the mass and energy required for the mission – where a smaller and less energetic probe is assumed to be ready sooner than a larger, energy-intensive probe.
The most difficult duration to estimate, even when relaxed to relative instead of absolute comparisons, is the pace of research. Provisional comparative methods have been outlined, but this is an area needing further attention. The reason that this must be included – even if difficult – is because the timescales for interstellar flight are comparable to breakthrough advancements.
The fastest mission concepts (from launch to data return) are 5 decades, even for StarShot (not including research and infrastructure). Compare this to the 7 decades it took to advance from the rocket equation to having astronauts on the moon (1903-1969), or the 6 decades to go from the discovery of radioactivity to having a nuclear power plant tied to the grid (1890-1950).
So, do you pursue a lesser technology that can be ready sooner, a revolutionary technology that will take longer, or both? For example, what if technology A is estimated to need just 10 more years of research, but 25 years to build its infrastructure, while option B is estimated to take 25 more years of research, but will require no infrastructure. In that case, if all other factors are equal, option B is quicker.
To measure the cost of missions, a more fundamental currency than dollars is used – energy. Energy is the most fundamental commodity of all physical transactions, and one whose values are not affected by debatable economic models. Again, this is anchoring the comparisons in relative, rather than the more difficult, absolute terms. The energy cost includes the aforementioned infrastructure creation plus the energy required for propulsion.
Comparing the divergent propulsion methods requires converting their method-specific measures to common factors. Laser-sail performance is typically stated in terms of beam power, beam divergence, etc. Rocket performance in terms of thrust, specific impulse, etc. And warp drives in terms of stress-energy-tensors, bubble thickness, etc. All these type-specific terms can be converted to the more fundamental and common measures of energy, mass, and time.
To make these conversions, the propulsion options are divided into 4 analysis groups, where the distinction is if power is received from an external source or internally, and if their reaction mass is onboard or external. Further, as a measure of propulsion efficiency (or in NASA parlance, “bang for buck”) the ratio of the kinetic energy imparted to the payload, to the total energy consumed by the propulsion method, can be compared.
The other reason that energy is used as the anchoring measure is that it is a dominant factor with interstellar flight. Naively, the greatest challenge is thought to be speed. The gap between the achieved speeds of chemical rockets and the target goal of 10% lightspeed is a factor of 400. But, increasing speed by a factor of 400 requires a minimum of 160,000 times more energy. That minimum only covers the kinetic energy of the payload, not the added energy for propulsion and inefficiencies. Hence, energy is a bigger deal than speed.
For an example, consider the 1-gram StarShot spacecraft traveling at 20% lightspeed. Just its kinetic energy is approximately 2 TJ. When calculating the propulsive energy in terms of the laser power and beam duration, (100 GW for minutes) the required energy spans 18 to 66 TJ, for just a 1-gram probe. For comparison, the energy for a suite of 1,000 probes is roughly the same as 1-4 years of the total energy consumption of New York City (NYC @ 500 MW).
Delivering more energy faster requires more power. By launching only 1 gm at a time, StarShot keeps the power requirement at 100 GW. If they launched the full suite of 1000 grams at once, that would require 1000 times more power (100 TW). Power is relevant to another under-addressed issue – the challenge of getting rid of excess heat. Hypothetically, if that 100 GW system has a 50% efficiency, that leaves 50 GW of heat to radiate. On Earth, with atmosphere and convection, that’s relatively easy. If it were a space-based laser, however, that gets far more dicey. To run fair comparisons, it is desired that each concept uses the same performance assumptions for their radiators.
Knowing how to compare the options is one thing. The other need is knowing which problems to solve. In the general sense, the entire span of interstellar challenges have been distilled into this “top 10” list. It is too soon to rank these until after running some test cases:
- Communication – Reasonable data rates with minimum power and mass.
- Navigation – Aiming well from the start and acquiring the target upon arrival, with minimum power and mass. (The ratio of the distance traversed to a ½ AU closest approach is about a million).
- Maneuvering upon reaching the destination (at least attitude control to aim the science instruments, if not the added benefit of braking).
- Instrumentation – Measure what cannot be determined by astronomy, with minimum power and mass.
- High density and long-term energy storage for powering the probe after decades in flight, with minimum mass.
- Long duration and fully autonomous spacecraft operations (includes surviving the environment).
- Propulsion that can achieve 400 times the speed of chemical rockets.
- Energy production at least 160,000 times chemical rockets and the power capacity to enable that high-speed propulsion.
- Highly efficient energy conversion to minimize waste heat from that much power.
- Infrastructure creation in affordable, durable increments.
While those are the general challenges common to all interstellar missions, each propulsion option will have its own make-break issues and associated research goals. At this stage, none of the ideas are ready for mission trade studies. All require further research, but which of those research paths might be the most impactive, and under what circumstances? It is important to repeat that this study is not about picking “one solution” for a mission. Instead, it is a process for continually making the most impactive advances that will not only enable that first mission, but the continually improving missions after that.
Ad astra incrementis.

Planet Formation: How Ocean Worlds Happen
It’s hard to fathom when we look at a globe, but our planet Earth’s substantial covering of ocean is relatively modest. Alternative scenarios involving ‘water worlds’ include rocky planets whose silicate mantle is covered in a deep, global ocean, with no land in sight. Kilometer after kilometer of water covers a layer of ice on the ocean floor in these models, making it unlikely that the processes that sustain life here could develop — how likely is a carbon cycle in such a scenario, and without it, how do we stabilize climate and make an inhabitable world?
These are challenging issues as we build the catalog of exoplanets and try to figure out local conditions. But it’s also intriguing to ask what made Earth turn out as dry as it is. Tim Lichtenberg developed a theory while doing his thesis at the Eidgenössische Technische Hochschule in Zürich (he is now at Oxford), and now presents it in a paper in collaboration with colleagues at Bayreuth and Bern, as well as the University of Michigan. Lichtenberg thinks we should be looking hard at the radioactive element Aluminium-26 (26Al).
Go back far enough in the evolution of the Solar System and kilometer-sized planetesimals made of rock and ice moved in a circumstellar disk around the young Sun, eventually through the process of accretion growing into planetary embryos. In this era a supernova evidently occurred in the astronomical neighborhood, depositing 26Al and other elements into the mix. Using computer simulations of the formation of thousands of planets, the researchers argue that two distinct populations emerge, water worlds and drier worlds like Earth.
“The results of our simulations suggest that there are two qualitatively different types of planetary systems,” says Lichtenberg: “There are those similar to our Solar System, whose planets have little water. In contrast, there are those in which primarily ocean worlds are created because no massive star, and so no Al-26, was around when their host system formed. The presence of Al-26 during planetesimal formation can make an order-of-magnitude difference in planetary water budgets between these two species of planetary systems.”
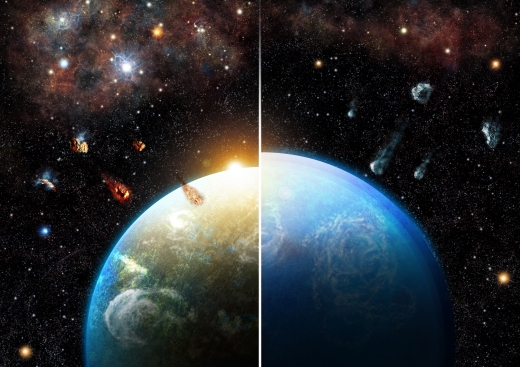
Image: Planetary systems born in dense and massive star-forming regions inherit substantial amounts of Aluminium-26, which dries out their building blocks before accretion (left). Planets formed in low-mass star-forming regions accrete many water-rich bodies and emerge as ocean worlds (right). Credit: Thibaut Roger.
Because planets grow from these early planetesimals, their composition is critical. If a great part of a planet’s water comes from them, then the danger of accreting too much water is always present if many of the constituent materials come from the icy regions beyond the snowline. But radioactive constituents like 26Al inside the planetesimals can create heat that can evaporate much of the initial water ice content before accretion occurs. Dense star-forming regions are more likely to produce planets that manifest these latter outcomes.
Lichtenberg and team examined the decay heat from 26Al in terms of this early planetesimal evolution, which would have led to silicate melting and degassing of primordial water abundances. Their simulations of planet populations delved into internal structures that varied according to disk structures, planetary composition, and initial location of planetary embryos. They produced statistical variations of incorporated water in planets that varied in radius and initial 26Al abundance. In all, the authors achieved what they believe to be a statistically representative set of 540,000 individual simulations over 18 parameter sets.
Image: This is Figure 3 from the paper. Caption: Fig. 3 | Qualitative sketch of the effects of 26Al enrichment on planetary accretion. Left, 26Al-poor planetary systems; right, 26Al-rich planetary systems. RP, planetary radius. Arrows indicate proceeding accretion (middle), planetesimal water content (bottom right, blue-brown) and live 26Al (bottom right, red-white). Credit: Lichtenberg et al.
We wind up with planetary systems with 26Al abundances similar to or higher than the Solar System forming terrestrial planets with lower amounts of water, an effect that grows more pronounced with distance from the host star, since embryos forming there are likely to be richer in water. Systems poor in 26Al are thus far more likely to produce water worlds. A remaining question involves the actual growth of rocky planets, as the paper notes:
If rocky planets grow primarily from the accumulation of planetesimals, then the suggested deviation between planetary systems should be clearly distinguishable among the rocky exoplanet census. If, however, the main growth of rocky planets proceeds from the accumulation of small particles, such as pebbles, then the deviation between 26Al-rich and 26Al-poor systems may become less clear, and the composition of the accreting pebbles needs to be taken into account.
The direction of future work to explore the question is clear;
… models of water delivery and planet growth need to synchronize the timing of earliest planetesimal formation, the mutual influence of collisions and 26Al dehydration, the potential growth by pebble accretion, and the partitioning of volatile species between the interior and atmosphere of growing protoplanets in order to further constrain the perspectives for rocky (exo-)planet evolution.
The paper is Lichtenberg et al., “A Water Budget Dichotomy of Rocky Protoplanets from 26Al-Heating,” Nature Astronomy Letters, 11 February 2019 (abstract). Thanks to John Walker for helpful information regarding this story.
Looking Back from System’s Edge
Sometimes the way we discover new things is by looking back, as witness the blue haze of Pluto. The image below comes, of course, from New Horizons, taken after the flyby and looking back in the direction of the Sun. Here we’re looking at a mosaic combining black and white LORRI images (Long Range Reconnaissance Imager) and enhancing them with lower-resolution color data from the Ralph/Multispectral Visible Imaging Camera (MVIC). The result, taken about 3.5 hours after closest approach, is in approximately true color.

Image: Pluto as seen by New Horizons from 200,000 kilometers after the flyby. The spectacular blue haze, extending to over 200 kilometers in altitude, is the result of sunlight acting on methane and other molecules in Pluto’s atmosphere to produce a photochemical haze. Credit: NASA/Johns Hopkins University Applied Physics Laboratory/Southwest Research Institute.
Ultima Thule likewise yields more of its secrets as we look at data from beyond the closest encounter. New Horizons’ latest target produced departure imagery fleshing out our view of the object’s shape by showing us parts of the KBO that were not illuminated by the Sun during the approach. We learn that the two lobes of Ultima Thule are not spherical at all, but rather that the larger lobe is flattened into a pancake shape, while the New Horizons team sees in the smaller lobe a resemblance to a dented walnut. Here is a video rendering of the data.
Image: Mission scientists created this “departure movie” from 14 different images taken by the New Horizons Long Range Reconnaissance Imager (LORRI) shortly after the spacecraft flew past the Kuiper Belt object nicknamed Ultima Thule (officially named 2014 MU69) on Jan. 1, 2019. The central frame of this sequence was taken on Jan. 1 at 05:42:42 UT (12:42 a.m. EST), when New Horizons was 8,862 kilometers (5,494 miles) beyond Ultima Thule, some 6.6 billion kilometers (4.1 billion miles) from Earth. The object’s illuminated crescent is blurred in the individual frames because a relatively long exposure time was used during this rapid scan to boost the camera’s signal level – but the science team combined and processed the images to remove the blurring and sharpen the thin crescent. This is the farthest movie of any object in our Solar System ever made by any spacecraft. Credit: NASA/Johns Hopkins Applied Physics Laboratory/Southwest Research Institute/National Optical Astronomy Observatory.
“We’ve never seen something like this orbiting the Sun,” says mission PI Alan Stern, adding:
“We had an impression of Ultima Thule based on the limited number of images returned in the days around the flyby, but seeing more data has significantly changed our view. It would be closer to reality to say Ultima Thule’s shape is flatter, like a pancake. But more importantly, the new images are creating scientific puzzles about how such an object could even be formed.”

Image: New Horizons took this image of Ultima Thule on Jan. 1, 2019, when the NASA spacecraft was 8,862 kilometers (5,494 miles) beyond it. The image to the left is an “average” of ten images taken by the Long Range Reconnaissance Imager (LORRI); the sharper processed view is to the right. Credit: NASA/Johns Hopkins Applied Physics Laboratory/Southwest Research Institute/National Optical Astronomy Observatory.
Observing stars as they disappeared when Ultima Thule passed in front of them allowed scientists to further refine the shape. The illustration below shows the evolution of our understanding, as we’ve moved from the ‘snowman’ to the ‘pancake’ model.
“While the very nature of a fast flyby in some ways limits how well we can determine the true shape of Ultima Thule, the new results clearly show that Ultima and Thule are much flatter than originally believed, and much flatter than expected,” adds Hal Weaver, New Horizons project scientist from the Johns Hopkins Applied Physics Laboratory. “This will undoubtedly motivate new theories of planetesimal formation in the early solar system.”
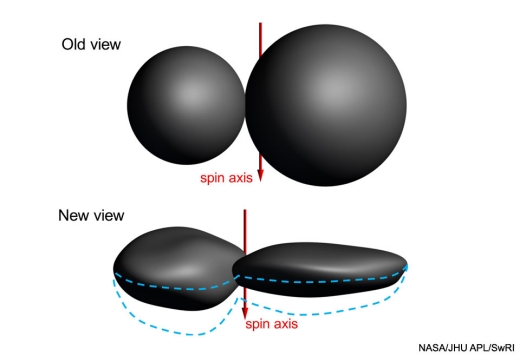
Image: Scientists’ understanding of Ultima Thule has changed as they review additional data. The “old view” in this illustration is based on images taken within a day of New Horizons’ closest approach to the Kuiper Belt object on Jan. 1, 2019, suggesting that both “Ultima” (the larger section, or lobe) and “Thule” (the smaller) were nearly perfect spheres just barely touching each other. But as more data were analyzed, including several highly evocative crescent images taken nearly 10 minutes after closest approach, a “new view” of the object’s shape emerged. Ultima more closely resembles a “pancake,” and Thule a “dented walnut.” The bottom view is the team’s current best shape model for Ultima Thule, but still carries some uncertainty as an entire region was essentially hidden from view, and not illuminated by the Sun, during the New Horizons flyby. The dashed blue lines span the uncertainty in that hemisphere, which shows that Ultima Thule could be either flatter than, or not as flat as, depicted in this figure. Credit: NASA/Johns Hopkins University Applied Physics Laboratory/Southwest Research Institute.
2019 Symposium Call for Papers

6th Interstellar Symposium and Interstellar Propulsion Workshop – TVIW 2019
In collaboration with the National Aeronautics and Space Administration (NASA), the Tennessee Valley Interstellar Workshop (TVIW) hereby invites participation in its 6th Interstellar Symposium and Interstellar Propulsion Workshop -hosted by Wichita State University (WSU) and Ad Astra Kansas Foundation – to be held from Sunday, November 10 through Friday, November 15, 2019, in Wichita, Kansas. The 2019 TVIW has the following elements:
The NASA Workshop on Interstellar Propulsion will focus solely on physics-based propulsion technologies that have the potential to meet the goal of launching an interstellar probe within the next century and achieving .1c transit velocity: Beamed Energy Propulsion, Fusion, and Antimatter.
At this meeting, the state-of-the-art of each will be examined, competing approaches to advancing the Technology Readiness Level (TRL) of each will be presented by advocates and assessed by non-advocates for synthesis into a workshop report to serve as the blueprint for possible future interstellar propulsion technology development.
The Interstellar Symposium will focus on all other aspects of interstellar travel excluding the advanced propulsion technologies to be covered in the NASA Workshop on Interstellar Propulsion, such as power, communications, system reliability/maintainability, psychology, crew health, anthropology, legal regimes and treaties, ethics, exoplanet science (possible destinations), and related research.
Working Tracks are collaborative, small group discussions around a set of interdisciplinary questions on an interstellar subject with the objective of producing “roadmaps” and/or publications to encourage further developments in the respective topics. This year we will be organizing the Working Tracks to follow selected plenary talks with focused discussions on the same topic.
Sagan Meetings. Carl Sagan famously employed this format for his 1971 conference at the Byurakan Observatory in old Soviet Armenia, which dealt with the Drake Equation. Each Sagan Meeting will invite five speakers to give a short presentation staking out a position on a particular question. These speakers will then form a panel to engage in a lively discussion with the audience on that topic.
Seminars are 3-hour presentations on a single subject, providing an in depth look at that subject. Seminars will be held on Sunday, November 10, 2019, with morning and afternoon sessions. The content must be acceptable to be counted as continuation education credit for those holding a Professional Engineer (PE) certificate.
Other Content includes, but is not limited to, posters, displays of art or models, demonstrations, panel discussions, interviews, or public outreach events.
Publications: Since TVIW serves as a critical incubator of ideas for the interstellar community, we intend to publish the work of TVIW 2019 in many outlets, including a complete workshop proceedings in book form.
No Paper, No Podium: If a written paper is not submitted by the final manuscript deadline, authors will not be permitted to present their work at the event. Papers should be original work that has not been previously published. Select papers may be submitted for professional publication, such as in the Journal of the British Interplanetary Society (JBIS).
Video and Archiving: All TVIW events may be captured on video or in still images for use on the TVIW website, in newsletters and social media. All presenters, speakers and selected participants will be asked to complete a Release Form that grants permission for TVIW to use this content as described.
ABSTRACT SUBMISSION
Abstracts for presented papers/presentations at TVIW 2019 may be submitted to either of two categories:
1. NASA Workshop on Interstellar Propulsion
2. Interstellar Symposium
Topics for Working Tracks, Sagan Meetings, Seminars, and Other Content are NOT solicited at this time.
Abstracts for the NASA Workshop on Interstellar Propulsion must relate to one of the three propulsion technologies of interest (Beamed Energy Propulsion, Fusion, and Antimatter) and should include the aspects of recent research, an assessment of the technology’s Technology Readiness Level (TRL) using NASA’s definitions found here, and a discussion of critical technical issues to be resolved with realistic, near-term technical development milestones identified (including relevant performance metrics).
Abstracts for the Interstellar Symposium must related to one or more of the many other interstellar mission related topics, such as power, communications, system reliability/maintainability, psychology, crew health, anthropology, legal regimes and treaties, ethics, exoplanet science (possible destinations), and propulsion technologies not explicitly called for in the NASA Workshop on Interstellar Propulsion.
Abstracts due: July 30, 2019.
All abstracts must be submitted online here.
PRESENTING AUTHOR(S) – Please list ONLY the author(s) who will actually be in attendance and presenting at the conference. (first name, last name, degree -for example, Susan Smith, MD)
ADDITIONAL AUTHORS – List all authors here, including Presenting Author(s) – (first name, last name, degree(s) – for example, Mary Rockford, RN; Susan Smith, MD; John Jones, PhD)
ABBREVIATIONS within the body should be kept to a minimum and must be defined upon first use in the abstract by placing the abbreviation in parenthesis after the represented full word or phrase. Proprietary drug names and logos may NOT be used. Non-proprietary (generic) names should be used.
ABSTRACT LENGTH – The entire abstract, (EXCLUDING title, authors, presenting author’s institutional affiliation(s), city, state, and text), including any tables or figures should be a maximum of 350 words. It is your responsibility to verify compliance with the length requirement.
Abstract Structure – abstracts must include the following headings:
- Title – the presentation title
- Background – describes the research or initiative context
- Objective – describes the research or initiative objective
- Methods – describes research methodology used. For initiatives, describes the target population, program or curricular content, and evaluation method
- Results – summarizes findings in sufficient detail to support the conclusions
- TRL Assessment and Justification (NASA Propulsion Workshop only)
- Development Roadmap (NASA Propulsion Workshop only)
- Near-term technical milestones and performance metrics (NASA Propulsion Workshop only)
- Conclusions – states the conclusions drawn from results, including their applicability.
Questions and responses to this Call for Papers, Workshops and Participation should be directed to: info@tviw.us
For updates on the meeting, speakers, and logistics, please refer to the website: https://tviw.us/2019-symposium/
TVIW is incorporated in the State of Tennessee as a non-profit education organization. TVIW is a tax-exempt, 501(c)(3) educational, non-profit corporation by U.S. Internal Revenue Service. For U.S. tax purposes, all donations to TVIW are fully tax deductible (as allowed by your local laws).
Copyright © 2019 Tennessee Valley Interstellar Workshop, Inc. (TVIW), All rights reserved.
SETI’s Charismatic Megafauna
The search for technosignatures that could flag the presence of extraterrestrial cultures has accelerated in recent times with projects like Glimpsing Heat from Alien Technologies at Penn State and numerous papers. Or is the better term not ‘cultures’ but ‘societies,’ or ‘civilizations’? SETI’s funding challenges, at least from government agencies, point to the need for defining its terms in ways that NASA, for example, can live with. Nick Nielsen examines the question in today’s essay, probing the issue of terminology in relation to public support, and noting the ongoing effort to evaluate and revise how SETI is described. Nielsen, a frequent Centauri Dreams contributor and a member of the board of directors for Icarus Interstellar, is a prolific writer who tracks these and other space-related issues in Grand Strategy: The View from Oregon, and Grand Strategy Annex.
by J. N. Nielsen

Recently there have been some signs that NASA may consider a rapprochement with SETI and SETI scientists, after more than twenty years of a de facto NASA ban on funding SETI (cf. NASA Renews Interest in SETI by David Grinspoon). It’s not yet clear how far this rapprochement will extend, but NASA did lend its name to the NASA Technosignatures Workshop (NTW18) last September. The event webpage names the Lunar and Planetary Institute, Universities Space Research Association, and National Aeronautics and Space Administration as having provided “institutional support”; I do not know if this involved financial support from NASA. The recent NASA Technosignatures Workshop also resulted in a 70 page paper, “NASA and the Search for Technosignatures: A Report from the NASA Technosignatures Workshop.”
I have to wonder if the term “technosignatures” is ultimately more palatable than the acronym “SETI,” with the latter’s explicit reference to ETI (extraterrestrial intelligence). “Technosignatures” sounds tech-savvy and doesn’t explicitly invoke aliens, though the idea of aliens is still there implicitly as a presupposition. This may sound like an overly-subtle gloss on the situation, but it is still a significant consideration. It is conceivable that NASA eventually will consider funding projects that mention “technosignatures” while continuing to pass over any project that mentions “SETI.”
The need to re-brand SETI was discussed in ‘Search for Extraterrestrial Intelligence’ Needs a New Name, SETI Pioneer Says by Calla Cofield, primarily discussing the recent work of SETI notable Jill Tarter. The author attributes to Tarter the idea that the acronym “SETI,” and what it has come to signify, “…generates an incorrect perception of what scientists in this field are actually doing.” Tarter also discusses the need for terminology reform. The question of SETI terminology has come in for a lot of discussion lately. We have seen the explicit consideration of SETI terminology in Wright’s paper “Taxonomy and Jargon in SETI as an Interdisciplinary Field of Study” and in the collective effort “Recommendations from the Ad Hoc Committee on SETI Nomenclature” by Jason T. Wright, Sofia Sheikh, Iván Almár, Kathryn Denning, Steven Dick, and Jill Tarter.
I found myself rather annoyed by the second of the two papers named in the paragraph above (I will henceforth call it the “Recommendations paper”), because it failed to deal with the hard conceptual problems presented by the terminology commonly used, and the hardest problems are usually the most interesting problems once you buckle down and focus on them with a will to really understand what is going on. Usually one finds that vague and imprecise terms paper over a multitude of subtle meanings, easily conflated, and it is a lot of work—sometimes tedious work—to separate out all these threads and give a full accounting of the ideas that are the background of the natural language employed in a science before that science is fully formalized.
Early analytical philosophers had a word for this clarification that has sadly fallen out of use: explication; take a look at Chapter 1 of Carnap’s Logical Foundations of Probability, “On Explication,” for a detailed exposition of explication. Carnap’s conception of explication could provide a framework for thinking about the explication of concepts employed in SETI. It was disappointing to me that the Recommendations paper is a laundry list of terms to use and terms to avoid, but, in fairness to the authors, the remit of the ad hoc committee was, “…to recommend standardized definitions for terms,” and not a root-and-branch re-thinking of the conceptual foundations of the discipline (which is what I would have liked to have seen).
Of particular interest to me in the Recommendations paper was its treatment of “civilization”:
Civilization
In a SETI context, e.g. (extraterrestrial or alien civilization) usually synonymous with technological species. Use with care.
Notes: The term civilization has imprecise popular meanings, but also particular scholarly meanings in relation to human history that are not generally what is meant by the term in a SETI context. Because of its ambiguity and anthropocentrism, the term is a suboptimal synonym for technological species, but it is nonetheless widely used in the literature. Society is a good alternative but not yet in common use.
It could be pointed out that “society” also has both imprecise popular meanings and particular scholarly meanings, so it is difficult to say how “society” is any better in this respect than “civilization.” I also question the idea that “technological species” is in any sense more precise or any less ambiguous than “civilization.”
The authors of the paper note that the use of “civilization” in SETI differs from its use in other scholarly contexts, but they don’t seem to be at all interested in why this is the case, or in finding some conception of civilization that is non-anthropocentric and is equally suitable for use in SETI and other sciences. This would be like someone saying that “BTU” is used to indicate energy in heating and “watt” is used to indicate energy in electricity, but that there is no need for any common conception of energy that might be an umbrella conception for BTU and watt (or calorie, or joule, etc.).
The same paper takes on the use of the term “advanced,” and while I agree that the term “advanced” is problematic, it is not problematic for the reasons cited in the paper. “Advanced” in isolation means nothing; it is a relational term. What would make sense is a formulation such as “x is more advanced than y.” With a little refinement we get, “x is a more advanced F than y.” Now, this latter formulation could be said to be in the same spirit as the recommendation in the paper of, “…simply specifying the scale or nature of the technology referenced.” I’m on board with this, as long as it is made clear that “advanced” is a relational term that is meaningless in isolation. What we find in most cases of using “advanced” in isolation is that the comparison is implicit; one of the virtues of formalizing any usage in a schema such as, “x is a more advanced F than y,” is that it forces us to make our assumptions explicit.
Clearly, however, the authors of the Recommendations paper mean to condemn, “…deprecated theories of human history which rank human societies from ‘primitive’ to ‘advanced’ based on ill-defined and ethnocentric measures.” No doubt the authors have the most virtuous motives for condemning what they see as ethnocentric measures to distinguish primitive from advanced civilizations, but—Alas!—science is unconcerned with the virtue of its practitioners, or the lack thereof. We could go a long way toward improving the situation by offering a precisely defined scale by which civilizations could be rank-ordered, but I doubt that this would quell the misgivings of those whose concern is addressing the grievances claimed to follow from ethnocentric bias. I will say no more at present regarding this.
In addition to his advocacy for SETI terminology reform, Jason Wright has also argued strongly that SETI is and ought to be a part of astrobiology (cf. “SETI is Part of Astrobiology”). Wright counters the official NASA line that, “Traditional SETI is not part of astrobiology,” by arguing that some of the most obvious signs of terrestrial habitability are Earth’s technosignatures. Wright also points out that NASA arbitrarily excludes technosignatures from “traditional SETI.” Obviously, to the extent that NASA’s exclusion is arbitrary, it is dissatisfying. Given that NASA has been deeply involved with astrobiology since its inception (cf. The Living Universe: NASA and the Development of Astrobiology by Steven J. Dick and James E. Strick, which discusses NASA’s involvement in astrobiology since the term was introduced), if SETI is part of astrobiology, and NASA was present at the foundations of astrobiology, then the case could be made that NASA’s astrobiology program should include SETI as an integral component, organically present ab initio. That is to say, SETI is not some foreign body that has become inexplicably lodged in astrobiology.
However, in a Twitter post, Jason Wright referenced two posts by Dr. Linda Billings, SETI: on the edge of astrobiology and Astrobiology and SETI: different evolutionary pathways, which argue against including SETI under the umbrella of astrobiology. These posts conclude, respectively, “The bottom line is that traditional SETI—using ground-based radio telescopes to listen for signals of extraterrestrial intelligent origin—falls outside the boundaries of NASA’s astrobiology program.” And, “…the history/evolution of exo/astrobiology more closely parallels the history/evolution of planetary protection. Exo/astrobiology and SETI evolved on very different, non-parallel tracks.” Thus the argument whether SETI ought to be considered a part of astrobiology has been made both in the affirmative and in the negative. It seems pretty weak to me to argue that SETI is intrinsically about ground-based observations, as SETI observations from space-based telescopes would be a great boost for the discipline, if only these resources were made available to SETI research. Wright deals with this weakness as one of the erroneous perceptions he identifies that has led to the exclusion of SETI from NASA’s astrobiology portfolio.
Much of this discussion is taking place because SETI is poorly funded, and if government monies were made available to SETI researchers, the discipline could pursue a more ambitious scientific research program. But because SETI has been largely frozen out of government funding through NASA, which would be its natural home (unless, like Billings, we see the National Science Foundation funded ground-based telescopes as the natural home of SETI), SETI funding efforts have taken creative forms. One of these creative ways of doing SETI science on the cheap has been projects that can be described as “parasitic,” “piggyback,” and “opportunistic.” This was taken up explicitly by Jill Tarter in 1984 in “Parasitic, Piggyback and Opportunistic SETI: It’s Cheap and It Just Might Work?”
A year prior, in 1983, the idea was already floated in “The Berkeley parasitic SETI program” by S. Bowyer, G. Zeitlin, J. Tarter, M. Lampton, and W. J. Welch. And since then we have seen, “The SERENDIP piggyback SETI project” by M. Lampton, S. Bowyer, D. Werthimer, C. Donnelly, and W. Herrick (1992) and “An Opportunistic Search for ExtraTerrestrial Intelligence (SETI) with the Murchison Widefield Array” by S. J. Tingay, C. Tremblay, A. Walsh, and R. Urquhart (2016). The latter paper characterizes their “opportunistic” SETI as follows:
“In this Letter, we present a first, and opportunistic, SETI pilot experiment with the MWA, in the frequency range 103–133 MHz, placing limits on narrow band radio emission toward 38 known planetary systems. The experiment is opportunistic in the sense that the observations were undertaken for a spectral line survey of the Galactic Plane that is ongoing; utility of the data for a SETI experiment was realised post-observation.”
There is a kind of subtle irony in SETI science having to operate parasitically on other projects deemed more fundable, or, at least, projects that would not draw the ire of politicians looking for a soft budgetary target to attack. Arguably, whatever public support that there is for space exploration (and however correct or mistaken it may be to connect space exploration with SETI), derives from the hope, perhaps even the titillating hope, of finding something “out there” that would mean that we are not alone.
I have often said that any excitement over things like exoplanet searches always turns on whether the planets are habitable, any excitement over whether the planet is habitable largely turns on whether we can ever determine whether or not these planets actually have life, any excitement over whether or not we can determine if these planets have life largely turns on whether that life could be intelligent, and any excitement over whether or not this life could be intelligent largely turns on whether we might possibly communicate with or travel to these intelligent beings. Space science, then, is to a large extent an artifact of our cosmic loneliness, and our desire to mitigate that cosmic loneliness.
I’ve read a few candid comments to this effect (I can’t remember the source), and I have no doubt that this is the case. In the same way that conservation biology has an easier time raising money to fight for charismatic megafauna, but has a much more difficult time raising money based on conservation efforts for unattractive animals or very small animals, so too space science efforts do better when they are related to some “sexy” space science topic like aliens?—?but this has to be done sotto voce, with a wink and a nudge, because NASA, to be taken seriously, must keep up the appearance of high seriousness. NASA’s budgetary choices are held hostage by the “giggle factor.”
In a sense, then, it is space science that is parasitic upon SETI and human spaceflight (which appeals as a source of national pride in accomplishment), which, when the latter dominated NASA and NASA’s budget, took the lion’s share of the money and left little for space science. In recent decades, the focus has been more on space science, and so it is SETI (rather than prestige) which is the unspoken background to what is going on explicitly in the foreground. While I care deeply about space science, and I know how much NASA’s space science programs have transformed our knowledge of the universe, few in the wider public share my sentiments, and they cannot be expected to so share these sentiments. But they can share an interest in the “charismatic megafauna” of astrobiology, which are the intelligent aliens that SETI is seeking.
If NASA can embrace technosignatures as a part of astrobiology, it may find a way to excite the interest of the public while maintaining its scientific respectability. And if that requires a shift in terminology, I suspect that SETI researchers will be ready to make that shift. An article by Lisa Grossman, It’s time to start taking the search for E.T. seriously, astronomers say: Some scientists are pushing for NASA to make looking for alien technology an official goal, notes that Jason Wright is part of a group of scientists who are actively seeking to have the search for technosignatures incorporated into NASA’s next Decadal Survey, which, if successful, would mean federal funding for SETI projects. Everyone is well aware that such funding would transform the discipline, and SETI advocates are now actively campaigning for the funding.
We can already see this transition to the language of technosignatures taking place. For example, if we take as a recent example the paper, “A search for technosignatures from TRAPPIST-1, LHS 1140, and 10 planetary systems in the Kepler field with the Green Bank Telescope at 1.15-1.73 GHz” by Pavlo Pinchuk, et al., we find that “technosignatures” are mentioned repeatedly throughout the text, “extraterrestrial” is mentioned ten times, “SETI” is mentioned a couple of times (as well as in the bibliography, in an internet address, and in a title), “civilization” is mentioned once, and “alien” appears nowhere in the document.
Any scientific discipline, as it evolves, eventually revises its terminology, as it usually begins with imprecise terms taken from ordinary language and eventually settles upon more formalized usages that are defined with scientific precision, and which become the accepted jargon of the discipline. There is scientific precision in spades to be found in SETI research papers. What is wanting in SETI (and in discussions of technosignatures, for that matter) is the conceptual framework within which these terms are formulated. SETI science is strong, but its concepts are often weak and ambiguous, as is evidenced by the recent concern with terminology. I have had this conceptual weakness on my mind for some time, and I hope to be able to write more about this as I clarify my own thoughts on the matter. Others seem to have noted this weakness as well. In a paper that has just come out by Jim Pass of the Astrosociology Research Institute, Exo-Astrosociology and the Search for Technosignatures, Pass notes:
“Unlike with the regard to discoveries associated with the search for biosignatures mostly in our Solar System, which have produced discoveries and insights of tangible value, the research associated with the search for technosignatures is less impressive.”
The charismatic megafauna of SETI—little green men, space aliens, Martians, and their kin—are emblematic of this conceptual weakness, and they could be made more respectable with a prolonged inquiry into and clarification of the conceptual framework within which we discuss the possibility of the emergent complexities we know on Earth—life, sentience, consciousness, intelligence, mind, technology, and civilization, inter alia — also existing elsewhere. If we have gotten the sequence of emergent complexities right, this sequence begins with biology, and so is initially an astrobiological inquiry. However, at some point it becomes an inquiry larger than astrobiology (or, if you prefer, an inquiry no longer narrowly contained within the boundaries of biological thought), and our conceptual framework must expand in order to accommodate this larger domain of inquiry. Explication, then, could play a crucial role in exorcising space aliens and replacing them with a theoretical construction more consonant with NASA’s demand for high seriousness.
Perspectives Beyond the Moon
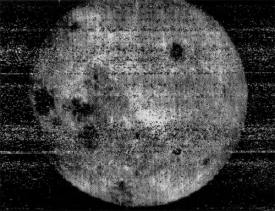
Today we re-enter the realm of perspective-altering photographs, images that open new vistas in our early reconnaissance of the Solar System. Before October 7, 1959, we had little knowledge of the far side of the Moon, even though librations allowed the occasional glimpse at extremely low angles of a small part of it. The Soviet moon probe Luna 3 took the first photographs of the far side, and was followed by the much better imagery of Zond 3 in 1965. NASA’s Lunar Orbiter program would continue the mapping as the 1960s progressed.
Image: First glimpse. The view of the Moon’s far side from Luna 3.
The far side would swim into vivid focus, of course, when Apollo 8 and subsequent missions took astronauts to the Moon, but it was up to the China National Space Administration to make the first soft landing there on January 3 of this year (Ranger 4 had impacted on the far side in 1962, but without returning data before impact). Working in this environment demanded a relay satellite to support communications with the Chang’e 4 mission on the surface.
The Queqiao satellite handles signals from the surface and relays them to Earth, working with a satellite called Longjiang-2, from which the image below was downloaded on February 3. Remember, for most of human history, we had no idea what the far side of the Moon looked like. Now we’ve not only mapped it, but can see a view of Earth with the entire far side laid out before us.
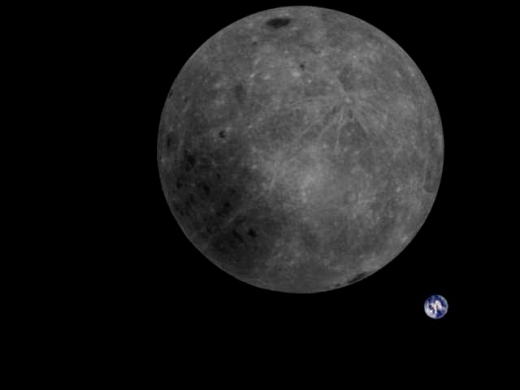
Image: Downloaded at the Dwingeloo Radio Observatory in the Netherlands, this view from Longjiang-2 shows the Earth and the Moon’s far side. The contrast in color is reminiscent of Bill Anders’ famous shot from Apollo 8, though here we see the Moon in its entirety.
Another perspective changer is the fact that Longjiang-2 is equipped with an amateur radio transceiver that allows radio amateurs to downlink telemetry and relay messages through it, as well as commanding it to take and downlink images, as explained in this page at the Dwingeloo website. What an opportunity for space-minded amateurs. They can work Longjiang-2 (call sign BJ1SN) and join the amateur team at Dwingeloo itself (PI9CAM) to see images that, not all that long ago, would have seemed astonishing. For many of us, ‘astonishing’ still applies.
I can’t leave the far side without comparing the above to the animation below, a spectacular shot of of the Earth and Moon as seen by the DSCOVR satellite (Deep Space Climate Observatory).

Image: This animation features satellite images of the far side of the Moon, illuminated by the Sun, as it crosses between the DSCOVR spacecraft’s Earth Polychromatic Imaging Camera (EPIC) and telescope, and the Earth — 1.6 million km (1 million miles) away. The times of the images span from 3:50 p.m. to 8:45 p.m. EDT on July 16, 2015. The time of the New Moon was at 9:26 p.m. EDT on July 15. Credit: NASA/NOAA.
Another perspective enhancer is the view below from MARCO-B, nicknamed WALL-E. Along with MARCO-A (also known as EVE), the CubeSat made it to Mars in a seven-month journey that provided data on the InSight landing on November 26, 2018. The data were valuable because Mars orbiters could not observe the entire landing sequence and route information swiftly back to Earth. The MARCOs returned data at each stage of the InSight descent and landing in near-real time, also beaming back InSight’s first image.
And despite the failure of MARCO-A’s camera, MARCO-B succeeded in fine fashion with the memorable animation below.

Image: MARCO-B, one of the experimental Mars Cube One (MARCO) CubeSats, took the images shown in the animation above as it approached Mars from about 575,000 kilometers (357,300 miles) to 18,000 kilometers (11,200 miles) away, just before NASA’s InSight spacecraft landed on Mars on Nov. 26, 2018. MARCO-B flew by Mars with its twin, MARCO-A, to serve as communications relays for InSight as it touched down on the Red Planet. Nicknamed WALL-E, MARCO-B took these images on Sunday, Nov. 25 and Monday, Nov. 26, 2018. The bright point of light to the left is the corner of MARCO-B’s high gain antenna feed and to the right is the high gain antenna, which let the CubeSat communicate with Earth. In this animation, Mars is spinning on its axis from right to left. Credit: NASA/JPL-Caltech.
There have been no further transmissions from MARCO-B since the end of December, while we last heard from MARCO-A in early January. We have this from JPL:
The mission team has several theories for why they haven’t been able to contact the pair. WALL-E has a leaky thruster. Attitude-control issues could be causing them to wobble and lose the ability to send and receive commands. The brightness sensors that allow the CubeSats to stay pointed at the Sun and recharge their batteries could be another factor. The MarCOs are in orbit around the Sun and will only get farther away as February wears on. The farther they are, the more precisely they need to point their antennas to communicate with Earth.
This summer the two diminutive spacecraft will begin moving back toward the Sun. MARCO-A is, based on calculations of its trajectory, now more than 3.2 million kilometers beyond Mars, while MARCO-B is 1.6 million kilometers past the planet. Further attempts to communicate with the CubeSats will be made later this year, but it’s not known how long the batteries and other parts of the spacecraft will last. Whether we hear from either again or not, the MARCOs have pushed the paradigms of size and cost and pointed the way to future missions, perhaps one day involving solar sails and networking technologies taken all the way to the outer planets.

Follow with RSS or E-Mail
