Centauri Dreams
Imagining and Planning Interstellar Exploration
NanoSail-D Back, Needs Tracking
Yesterday I had just written about the role of luck in dark energy observations (in reference to Adam Riess’ discovery of an HST supernova image critical to the investigation), when news came in of another stroke of good fortune. This one involves not an astronomical observation but an actual spacecraft, the NanoSail-D solar sail demonstrator, thought to be moribund after it failed to eject from the FASTSAT satellite on which it had piggybacked its way into low-Earth orbit.
Now we learn that NanoSail-D ejected from FASTSAT on its own and was identified in telemetry yesterday afternoon (UTC), as determined by an analysis of FASTSAT data and later confirmed by ground-based tracking stations. If you’re a ham radio operator, NASA is encouraging you to listen for the NanoSail-D signal, which should be found at 437.270 MHz. Any reports should be sent to the NanoSail-D2 Mission Dashboard, where the welcome ‘NanoSail Ejected’ message is now up. The beacon is evidently operational and we’ll see how subsequent tracking goes.
Note: The frequency was incorrectly stated in the original post as 437.275 MHz. Should be 437.270 MHz, as now fixed above.
A number of readers frustrated by NASA’s inability to explain NanoSail-D’s problems in greater detail have written in the past month to ask why the question of ejection was so mysterious. The answer is simple: We’re dealing with a CubeSat spacecraft, a vehicle equipped with the bare minimum in terms of telemetry. NanoSail-D is a terrific attempt to get a sail into space with the bare minimum of financial outlay, which is one reason I’ve been pulling so hard for its success. But flying on the cheap does pose problems when things go strangely awry.

The Marshall Space Flight Center ham station has its own Web page, where the detection of the sail’s successful ejection and the reaction of principal investigator Dean Alhorn were reported in these terms:
Last month we were listening on 437.275 MHz, trying to confirm ejection of NanoSail-D from NASA’s FastSat. Nothing was heard, confirming that the sub-satellite had not separated. Time goes by. . . (just over a month actually) and as Wednesday afternoon comes around, Stan – N4PMF receives a request from Dean Alhorn to try listening again.
WB5RMG and N4PMF went to the club station and got ready for the 4:50 pm flyover. Shortly after Dean arrived we heard the first packet, and thought we were going to need to scrape Dean off the ceiling – he nearly exploded with joy.
Image: I have a hunch the MARS team won’t mind if I poach their photo of Dean Alhorn reacting to the reception of telemetry from NanoSail-D. Right now good vibes are in the air all over Huntsville. Credit: MSFC/MARS.
Bear in mind that the downlink on 437.275 MHz is critical. It’s the only link we have to the spacecraft, and MSFC is saying its battery will last for about three more days. Thus the need to collect telemetry from as many locations as possible. In addition to the above link, you can follow the sail’s fortunes via Twitter @NanoSailD. In the growing tradition of spacecraft tweets speaking in the first person singular, an overnight tweet from the NanoSail team read “I am still trying to figure out why FASTSAT finally let me go. Maybe it was tired of me hanging around?”
More on NanoSail-D, with real-time satellite tracking data, here. Based on earlier tweets from Huntsville, the sail deployment is now expected somewhere around 10 PM EST tonight (0300 UTC on the 21st). What a surprise to find all this happening after the long delay, but let’s cross our fingers that sail deployment proceeds as planned. Even for a sail of this relatively small size (32 square meters) and a fairly straightforward deployment procedure, getting the sail out there and catching photons is always going to be the most worrisome part of any sail mission.

A Bracing Look at the Unseen Universe
Yesterday I planned to write a review of Richard Panek’s The 4 Percent Universe (Houghton Mifflin Harcourt, 2011), a fascinating look at dark matter and dark energy and the current state of our research into them. Panek is an excellent writer with an eye for detail and the human touch. He gets you into the thick of scientific controversy and brings out not only the issues but the personalities involved — the good news is that the personalities, particularly in the case of dark energy, didn’t seem to matter, because the major players reached the same conclusion.
")
But as I worked on the review, I found myself focusing on the dark energy side of the book, especially the question of how dark energy findings could be supported by other evidence. So while Panek spends an equal amount of time with dark matter, and runs through everything from dark matter candidates (WIMPs, MACHOs, etc.) to attempts to use gravitational lensing to constrain the population of dark objects (not to mention the ‘Bullet cluster’ analysis that did so much to show us dark matter’s impact within galactic clusters), I’ll spend my time where his own energy is the greatest, on the whirlwind controversy over an accelerating expansion.
The Cosmos As It Used to Be
Back in the 1920s, Edwin Hubble laid the groundwork for an expanding universe. Hubble used the period/luminosity relation in Cepheid variables (this was Henrietta Swan Leavitt’s work) to find the distances to nearby galaxies. He took the redshift for those galaxies as equivalent to their velocities. Panek explains how he graphed the distances he found against the galactic velocities, concluding they were directly proportional to each other. The relation seemed straightforward: The greater the distance, the greater the velocity. That was a relationship, one-to-one, that you could plot on a graph as a straight line on a 45-degree angle. Assume a constant rate of expansion and the straight line would continue no matter how far you looked.
But of course we also know that the universe is full of matter, and that matter attracts other matter by virtue of gravity. So it’s perfectly understandable to think that the expansion of the universe should be slowing, and the question becomes, what is the density of matter, and can we, by showing how fast the expansion is slowing, see what lies ahead for the cosmos? Can we push that straight line graph until it bends by using distant supernovae as our standard candles?
These are sound questions, but the scientists studying them had no reason to believe that by 1998, they would have changed our view of the cosmos. It was a breakthrough the likes of which astronomy has rarely seen, with two teams of passionate, committed scientists — working with their own agendas, each battling feverishly to get their work out ahead of the other guys — coming to the same startling conclusion. The straight line on the graph was bending the wrong way, and that meant the expansion wasn’t slowing. Type 1a supernovae at great distances were dimmer than they ought to be at their particular redshift, and thus further away than our theories said. The expansion of the universe was, in fact, speeding up.
And what do you do when you run into a result like that? Panek excels in following up the question, and if you ever wanted to see science at the level of everyday head-banging research, theories butting against each other, observations failing at critical, hair-pulling moments only to be replaced by serendipitous discoveries, this is the book for you. It says something that two combative teams working with mostly independent data sets and relying on different methods of analysis arrived at a conclusion that neither team had expected. Yet this is precisely what the High-z Supernova team and the Supernova Cosmology Project proceeded to do in 1998.
The Dark Energy Follow-Up
Re dark energy, the answer to the question of what to do next is, you set out to prove the effect doesn’t exist. Two possibilities immediately surfaced, the first being a new kind of dust. Astronomers already know how to correct for the dust within galaxies that makes light from them redder, but perhaps there was a different kind of dust — call it ‘gray dust,’ even if no one has a clue what it is — and posit that it exists between the galaxies. Or consider another possibility: Maybe Type 1a supernovae in the early universe were intrinsically fainter. Perhaps the supernova process was slightly different then, creating astronomical events that make us think they were more distant, when we are actually looking at a slightly different kind of object.
What to do? Step back from the question and consider that if the supernova evidence is correct, then the time we live in is one in which dark energy is dominant over matter, winning its battle with gravity and thus accounting for the universe’s continued expansion. What that means is that in the earlier universe, the further back you go, the smaller and denser the cosmos and the greater the gravitational influence of matter. Thus there would be a time when matter, not dark energy, was dominant, the expansion would have been decelerating, and supernovae would thus appear brighter than they should. That’s an observational test for dark energy alternatives.
Assuming you can find the right, incredibly distant supernova. And therein is the observational crux — ‘gray dust’ couldn’t account for such a supernova, nor could changes to how supernovae functioned in the early universe. The trick would be to find a supernova distant enough that it would have exploded in that far earlier era, and then to study it. Panek explains:
You would need a supernova that had exploded before the expansion of the universe ‘turned over’ — before the universe had made the transition from deceleration to acceleration, back when matter, not energy, was winning the tug of war. You would expect that supernova to be brighter than it ‘should’ be. Plot it on the Hubble diagram — way out there, far beyond the nearby supernovae from Calán/Tololo, beyond the high-redshift supernovae that the two teams had discovered — and the upward deviation from the 45-degree straight line that High-z and SCP had graphed would ‘turn over,’ too, just like the universe. It would dip down.
And if it didn’t, you’d have to rethink dark energy.
Being Dealt the Right Hand
Did I mention luck in all this? You can’t see supernovae this far across the universe with a ground-based telescope, but the Hubble Space Telescope can do the job, and in late 1997 it had been used to find such objects in the Hubble Deep Field image, which contained about three thousand galaxies. Adam Riess, working with the High-z collaboration while at the Space Telescope Science Institute, kept the two supernovae Hubble had found in mind. SN 1997ff and SN 1997fg needed follow-up, returning to the same field to make multiple reference images. The two supernovae were far enough out to test the scenario of a universe that was still slowing down rather than expanding, but only if later images could be found for comparison.
But there had been no follow-ups. It finally occurred to Riess that HST images from some unrelated observation might by utter chance contain one of the two supernovae. He surveyed Hubble’s work in the relevant time frame and, astoundingly enough, found that SN 1997ff had appeared in Hubble test images, made in 1997 when Shuttle astronauts had installed the Near Infrared Camera and Multi-Object Spectrometer. Using them, Riess was able to establish that SN 1997ff had exploded 10.2 billion years ago, far earlier than the time the expansion of the universe should have started to accelerate. At a spring Space Telescope Science Institute symposium in 2001, Riess produced his results using a transparency showing a chart of redshift against brightness of the supernovae found by both the High-z and SCP teams.
Panek’s treatment of the moment is worth lingering over, as Riess, covering part of the transparency, begins to reveal the data points showing the averages of supernovae at the various redshifts:
Riess revealed the first three dots on the transparency: here, and here, and here, the averages of the nearby supernovae from the Calán/Tololo survey.
Then, moving to the right, the next three dots: here, and here, and here, the averages of the distant supernovae from the SCP and High-z searches.
The dots were beginning to describe the now-familiar gentle departure from the straight line, the upward turn toward the dimmer. In six dots Riess had taken his audience from a few hundred million light-years across the universe, to a billion, then two billion, three, four. Now, he said, he had the point that represented SN 1997ff. He had determined its redshift to be about 1.7, the farthest supernova to date by a long shot, a distance of about eleven billion light years.
They knew what they were going to see, but the hundred or so astronomers in the auditorium couldn’t help themselves. They shifted in their seats. Leaned forward. Held back. Crossed arms.
There: SN 1997ff.
A gasp.
The gentle upward curve was gone. In its place was a sharp downward pivot. The supernova was twice as bright as you would naïvely expect it to be at that distance. The universe had turned over, allright.
While Riess went on to explain that the result ruled out the hypothetical effects of exotic gray dust or a change in the nature of supernovae at a confidence level greater than 99.99 percent, the evidence continued to loom on the screen behind him. His audience couldn’t take their eyes off it. For the astronomers of the invisible, it was something to see.
An Open-Ended Story
Thus Panek on a remarkable moment in our history, but then, there seem to be more and more remarkable moments these days. Now and then I hear astronomers comment on their own good luck to be living in a time when such monumental results are being discussed. For it’s not as if we have closed the book on dark matter and dark energy. As Panek shows throughout this provocative volume, and with the same verve he demonstrates above, we’re in a story that emphatically says ‘to be continued,’ one that is posing as many questions as it answers. His discussion of dark matter charts the problems of observing something that is by its nature unseen, and brings to life the personalities deeply involved in working out potential solutions.
This is a story about astronomers who found what they didn’t expect. “They weren’t looking for dark matter. They weren’t looking for dark energy. And when they found the evidence for dark matter and dark energy, they didn’t believe it.” Just how the evidence accumulated for both, and how scientists intend to probe more deeply into their mysteries, is what this book chronicles. It’s an intellectual feast that will provoke discussion and insight while acknowledging that we are only at the beginning of a new era in astronomy, one where the universe is in many ways something less than meets the eye. What a time to be alive and studying the heavens!
Inclined Orbits and Their Causes
The abundance of giant planets among the more than 500 exoplanets thus far identified is largely the result of our detection methods — we can find larger planets far more readily than smaller ones. But even as we bring our detections down to ever more Earth-sized worlds, we can go to work on the questions that giant planets close to their star raise. Current thinking is that planets like these must have formed far from their host stars and migrated to their current locations. Still to be determined are the mechanisms at work to make migration happen.
Intriguing new evidence is coming in from the National Astronomical Observatory of Japan, which has been working with data from the Subaru Telescope to study the orbital characteristics of two exoplanets, HAT-P-11 b and XO-4 b. The former, about 130 light years from Earth in the constellation Cygnus, shows a mass of 0.081 that of Jupiter, making it a Neptune-sized world in an eccentric 4.89-day orbit. The latter is a Jupiter-class planet of about 1.3 Jupiter masses, with a circular orbit of 4.13 days. What’s intriguing about both is that their orbits are highly tilted.
We’re talking about the angle between the axis of a star’s rotation and the planetary orbital axis, and herein lies a tale. To study such angles, we rely on the Rossiter-McLaughlin effect, which relates to radial velocity irregularities of an exoplanet as observed during a planetary transit. Have a look at the diagram below and marvel as I do at the amount of information we’re able to tease out of these signals, all of which involve planets that have never been directly imaged.

Image: Because of stellar rotation called “spin”, the stellar surface or “disk” has two parts: the approaching side (blue) and the receding side (red). During a planetary passage or “transit”, the observed radial velocity (RV) or speed of the star exhibits an apparent irregularity because of the stellar spin. When the transiting planet blocks the approaching side of the disk (blue), the star appears to be receding, and the RV shows an apparent red-shift. When the transiting planet conceals the receding side of the stellar disk, the star appears to be approaching, and the RV exhibits an apparent blue-shift. These anomalous RV shifts occur along the trajectory of the planet relative to the stellar disk. The diagram shows two different trajectories. The left panels indicate alignment between the stellar spin axis and the planetary orbital axis while the right panels show misalignment of the two axes by 50 degrees. Therefore, precise measurements of RVs during a planetary transit enable an estimation of the angle between the two axes. Credit: NAOJ.
As you can see in the second image (below), HAT-P-11 b’s orbit is highly inclined compared to the star’s rotational axis. The Rossiter-McLaughlin effect has been investigated for approximately 35 exoplanetary systems and seems to be a reliable indicator of orbital inclination. The recent NAOJ findings take Rossiter-McLaughlin to a new level by detecting the effect using one of the smaller exoplanets known. It’s challenging work given that the signal of the RM effect is proportional to the size of the planet. In HAT-P-11 b’s case, that makes for a faint signal indeed.

But back to the planetary formation model. As we learn of more systems with inclined planetary orbits, the evidence is pointing to planet-planet models of migration. One such scenario is called Kozai migration. Here the gravitational interactions between an inner giant planet and another massive object in the system can alter the planet’s orbit and push it closer to its star. The Kozai mechanism, first developed by Japanese astronomer Yoshihide Kozai in relation to asteroid orbits, can produced the kind of inclined orbits we see in these results, as can models based on giant planets forcing mutual scattering as they are formed within the protoplanetary disk.
Image: Illustration of the HAT-P-11 System Based on Observations from Subaru Telescope. The planet orbits the star in a highly inclined orbit. Credit: NAOJ.
What doesn’t seem to work as well, given the number of systems with inclined planetary orbits, is a model of disk-to-planet interaction as the cause of migration. Here we can create a scenario where the planet falls toward the central star, but these models predict that the spin axis of the star and the orbital axis of the planet will be in substantial alignment. The Rossiter-McLaughlin effect can’t tell us whether planet-planet scattering or Kozai migration is at work in a given system, but by developing a large sample of RM data, we should eventually be able to perform statistical analyses to draw conclusions about which model is the most plausible.
A Renewed Concern: Flares and Astrobiology
Before the recent American Astronomical Society meeting in Seattle gets too far behind us, I want to be sure to include an interesting story on red dwarfs in the coverage here. The story involves an extrasolar planet survey called SWEEPS — Sagittarius Window Eclipsing Extrasolar Planet Search, which used the Hubble Space Telescope to monitor 215,000 stars in the so-called Sagittarius Window (also called Baade’s Window, after Walter Baade, who discovered it with the 18″ Schmidt camera on Mt. Palomar). The ‘window’ offers a view of the Milky Way’s central bulge stars, which are otherwise blocked by dark clouds of galactic dust.
M-dwarfs are by far the most common type of star in the Milky Way, and therefore have major implications for the search for extraterrestrial life. We now know from SWEEPS data that these small stars are given to stellar flares that can have major effects on a planetary atmosphere. Flares have often been mentioned as a serious problem for the development of life on M-dwarf planets, but the new data tell us they may be more dangerous than we had thought, occurring on a regular and frequent basis. This BBC story quotes planet hunter Geoff Marcy:
“Such powerful flares bode ill for any possible biology, life, on any planet that happens to be close to that flaring star. It’s extraordinary to think that the most numerous stars, the smallest ones in our galaxy, pose this threat to life.”
How Red Dwarf Flares Happen
The threat, vividly portrayed in the results presented by Adam Kowalski (University of Washington) at the conference, involves an eruption of hot plasma that happens when magnetic field lines in a stellar atmosphere reconnect and release an amount of energy that can surpass that of 100 million atomic bombs. From the perspective of life on a planet orbiting an M-dwarf, the planetary surface is blasted with ultraviolet light and a bath of X-rays, along with the charged particles of the stellar wind. The SWEEPS study, with observations over a seven-day period, found 100 stellar flares in this largest continuous monitoring of red dwarfs ever undertaken.
You wouldn’t think small M-dwarfs would pack an impressive punch, but it turns out they have a deep convection zone where cells of hot gas can bubble to the surface in a process Rachel Osten (Space Telescope Science Institute) likens to ‘boiling oatmeal.’ It’s within this zone that the magnetic field is generated that produces the flare, a magnetic field stronger than our Sun’s. I learned from reading papers related to this topic that while sunspots cover less than one percent of the Sun’s surface, the star spots that cover a red dwarf can occupy fully half their surface. And it’s not just young, active stars that pose the threat, according to Osten:
“We know that hyperactive young stars produce flares, but this study shows that even in fairly old stars that are several billion years old, flares are a fact of life. Life could be rough for any planets orbiting close enough to these flaring stars. Their heated atmospheres could puff up and might get stripped away.”
Most flares last for only a few minutes, but some have been observed to persist for up to eight hours. Older stars do seem to flare less frequently than younger ones, but this survey, taken from data originally compiled in 2006 as part of an exoplanet hunt, tells us that flares continue to be an issue for M-dwarfs that have moved past their youth. Some of the surveyed stars grew as much as 10 percent brighter in a short period of time, making their flares much brighter than those from our Sun, and a few of the stars surveyed produced more than one flare.
Waiting for Stellar Maturity
I haven’t found the paper on this work, but related papers using other surveys include Hilton et al., “The Galactic M Dwarf Flare Rate,” from the Proceedings of the Cool Stars 16 Workshop (preprint) and Hilton et al., “M Dwarf Flares from Time-Resolved SDSS Spectra,” accepted for publication in The Astrophysical Journal (preprint). The latter gets into the age issue re flares. From the abstract: “We find that the flare duty cycle is larger in the population near the Galactic plane and that the flare stars are more spatially restricted than the magnetically active but non-flaring stars. This suggests that flare frequency may be related to stellar age (younger stars are more likely to flare) and that the flare stars are younger than the mean active population.”
With red dwarfs comprising 75 percent and perhaps more of the stars in our galaxy, the question of life around them may come down to how long it takes a flare star to attain a more sedate existence, with flare activity slowing to less threatening levels. On that score, we have much to learn. Because their lifetimes are far longer than the current age of the universe, we have no senescent red dwarfs to study.
Mapping Dark Matter in Ellipticals
Next week I’ll be reviewing Richard Panek’s The 4 Percent Universe (Houghton Mifflin Harcourt, 2011), a penetrating look at our investigations of dark matter and dark energy. But plenty of information has also come out of the American Astronomical Society’s 217th meeting, which ended yesterday. We looked at interesting gravitational lensing results in the previous post, pondering how they affected our census of high-redshift galaxies, but equally intriguing is a study of 14 massive galaxies that helps us map out the distribution of dark matter within them.
The work was led by David Pooley (Eureka Scientific), focusing on galaxies with strong gravitational lensing characteristics. The 14 galaxies average about 6 billion light years away, and they appear almost directly in front of even more distant galaxies that each include a supermassive black hole at galactic center with associated quasar. You know from our ongoing discussions of the FOCAL mission what to expect — light from the quasars is gravitationally lensed by the intervening galaxies to produce multiple images of the quasar.
Specifically, four images of the quasar appear as a result of light being ‘bent’ around the massive foreground object. Or perhaps the better way to put it is that the light is simply following the curvature of spacetime caused by the foreground galaxy. It’s this effect that makes light appear to bend. In any case, Pooley’s team went to work on the lensing images, using the Chandra X-ray Observatory to study them. Einstein’s general theory of relativity makes clear what the images should have looked like, but Chandra revealed some telling differences.
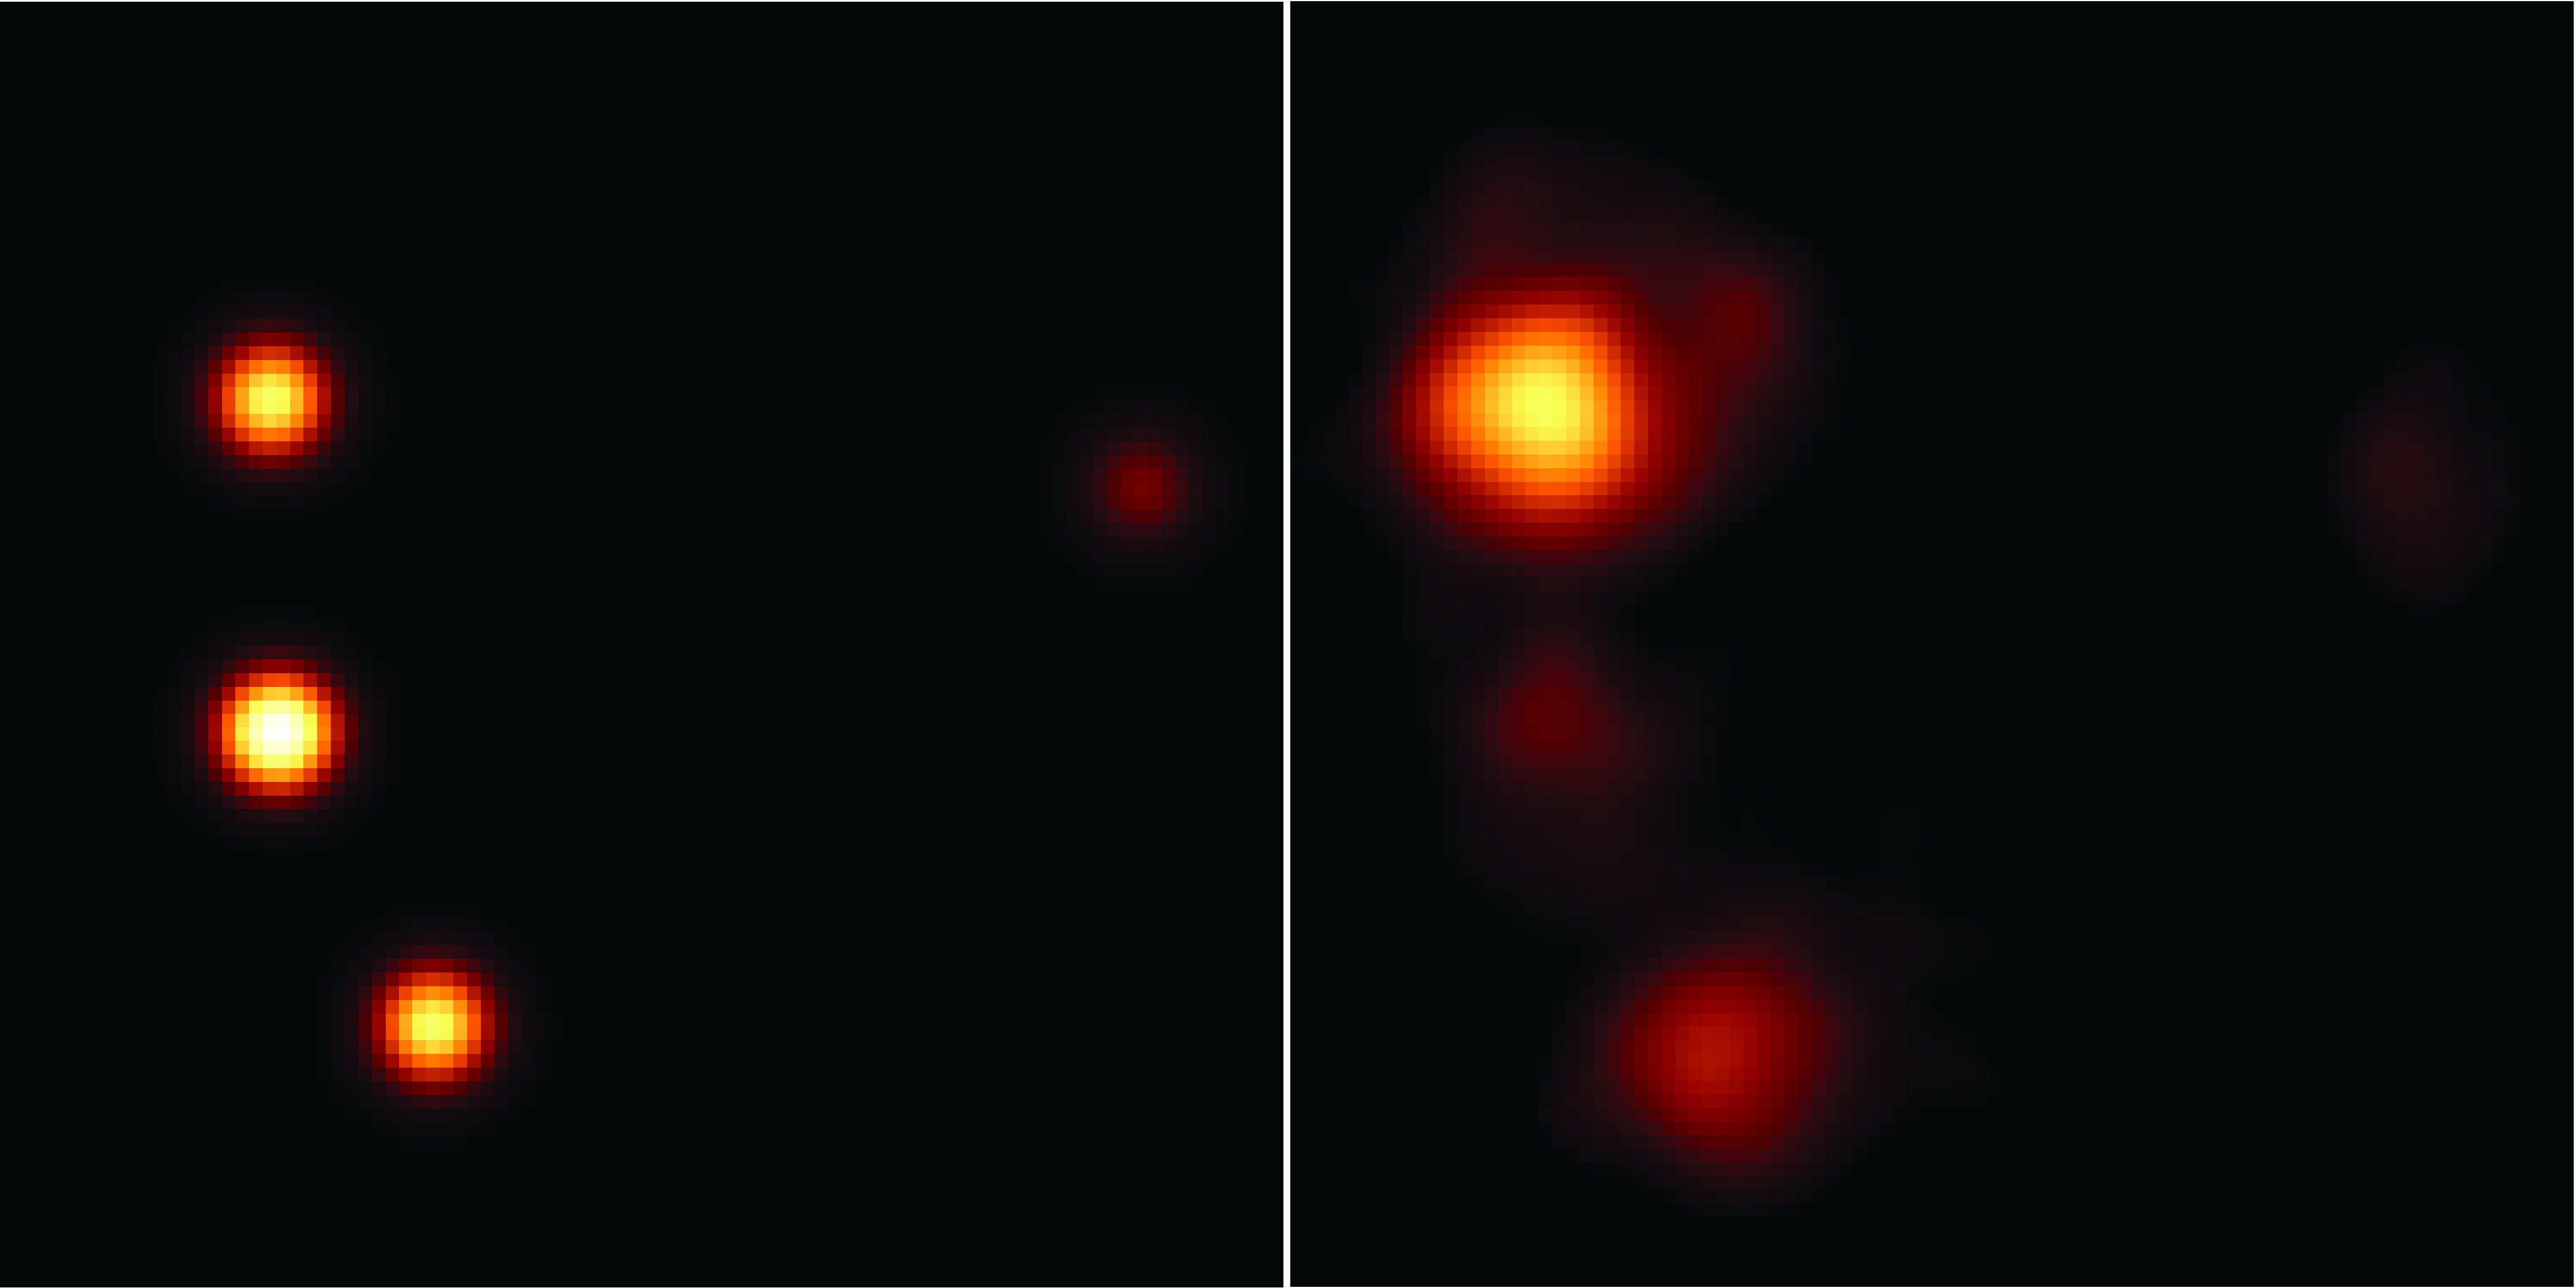
Image: Model prediction of what the four images of the background quasar RXJ 1131-1231 should look like, as lensed by an intervening galaxy (left). Chandra X-ray observations show a strong anomaly in the middle of the three images on the left side of the panel (right). Credit: D. Pooley (Eureka Scientific).
What’s going on? The aggregate gravitational field from all the matter in the foreground galaxy produces the gravitational lensing effect, creating the four distinct images of the distant quasar under study. And as the light passes through the lensing galaxy, it is also affected by the individual gravitational fields of the stars within the galaxy, what Pooley calls ‘lensing on top of lensing.’ How much the light is thus affected depends on both the number of stars and the amount of dark matter in the regions of the galaxy through which the quasar’s light passes.
If you simulate the effect with a galaxy made entirely of stars and completely devoid of dark matter, you do not get the Chandra results. Run the same simulation with a galaxy made entirely of dark matter and the results again diverge. Pooley’s team found that to match what Chandra sees, the galaxies must consist of 85 to 95 percent dark matter in the region through which the background light from the quasars passes. Interestingly, these regions are between 15,000 and 25,000 light years from the centers of the lensing galaxies.
Dark matter studies that work with cluster lensing, such as the famous Bullet Cluster analysis, focus on dark matter that is largely outside the individual galaxies in the cluster (we’ll be talking about the Bullet Cluster results again next week when I discuss Panek’s book). The new results look within elliptical galaxies to make their measurement. The more gravitationally lensed quasars we discover and observe with Chandra, the more these results will be refined, because working in the X-ray region of the spectrum gives far more precise results than optical studies. And because upcoming large-area surveys will doubtless increase our harvest of useful lensing phenomena, we can expect still more detailed maps of the dark matter within galaxies.
A Deep-Sky Look at Lensing
As we continue to investigate the parameters of the proposed FOCAL mission to the Sun’s gravitational lens, it’s worth recalling how the idea of lensing has taken hold in recent decades. Einstein noted the possibilities of such lensing as far back as 1936, but it wasn’t until 1964 that Sydney Liebes (Stanford University) worked out the mathematical theory, explaining how a galaxy between the Earth and an extremely distant object like a quasar could focus the latter’s light in ways that should be detectable by astronomers. And it wasn’t until 1979 that Von Eshleman (also at Stanford) applied the notion to using the Sun as a focusing object.
It was Eshleman who suggested sending a spacecraft to the Sun’s gravitational focus at 550 AU for the first time, where magnifications, especially at microwave frequencies like the hydrogen line at 1420 MHz, are potentially enormous. This was a year after the first ‘twin quasar’ image caused by the gravitational field of a galaxy was identified by British astronomer Dennis Walsh. Frank Drake went on to champion the uses of the Sun’s gravitational lens in a paper presented to a 1987 conference, but since then it has been Claudio Maccone who has led work on a FOCAL mission, including a formal proposal to the European Space Agency in 1993.
Lensing and Galactic Surveys
Although ESA did not have funds for FOCAL, Maccone continues to write actively about the mission in papers and books. He’ll also be fascinated to see how the subject is being discussed at the American Astronomical Society’s 217th annual meeting, which concludes today. A team led by Stuart Wyithe (University of Melbourne) has made the case in a presentation and related paper in Nature that as many as 20 percent of the most distant galaxies we can detect appear brighter than they actually are, meaning that lensing has gone from a curious effect to a significant factor in evaluating galaxy surveys to make sure they are accurate.
Rogier Windhorst (Arizona State) is a co-author of the paper that sums up this work. Windhorst uses the analogy of looking through a glass Coke bottle at a distant light and noticing how the image is distorted as it passes through the bottle. The Wyithe team now believes that gravitational lensing distorted the measurements of the flux and number density of the most distant galaxies seen in recent near-infrared surveys with the Hubble Space Telescope.
The notion makes sense when you realize that the farther and older the object under study, the more likely there will be something massive in the foreground to distort its image — after all, there is more foreground universe to look through the farther out we look. But this is the first work I know that suggests that gravitational lensing dominates the observed properties of the earliest galaxies. These are objects that, as we observe them, are between 650 million and 480 million years old, seen with Hubble at redshifts of z > 8-10 respectively. Foreground galaxies from a later era, when the universe was 3-6 billion years old, will gravitationally distort these early objects.
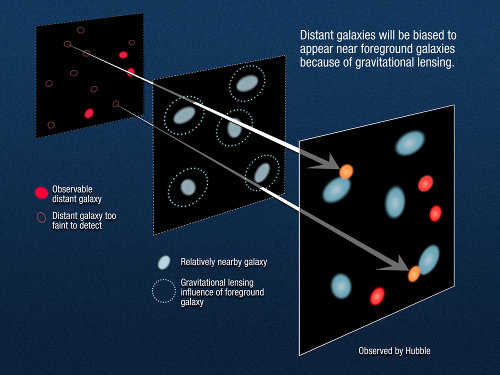
Image: This diagram illustrates how gravitational lensing by foreground galaxies will influence the appearance of far more distant background galaxies. This means that as many as 20 percent of the most distant galaxies currently detected will appear brighter because their light is being amplified by the effects of foreground intense gravitational fields. The plane at far left contains background high-redshift galaxies. The middle plane contains foreground galaxies; their gravity amplifies the brightness of the background galaxies. The right plane shows how the field would look from Earth with the effects of gravitational lensing added. Distant galaxies that might otherwise be invisible appear due to lensing effects. Credit: NASA, ESA, and A. Feild (STScI).
Windhorst doesn’t doubt that the distortions play a major role in our observations:
“We show that gravitational lensing by foreground galaxies will lead to a higher number of galaxies to be counted at redshifts z>8-10. This number may be boosted significantly, by as much as an order of magnitude. If there existed only three galaxies above the detection threshold at redshifts z>10 in the Hubble field-of-view without the presence of lensing, the bias from gravitational lensing may make as many as 10-30 of them visible in the Hubble images. In this sense, the very distant universe is like a house of mirrors that you visit at the State Fair — there may be fewer direct lines-of-sight to a very distant object, and their images may reach us more often via a gravitationally-bent path. What you see is not what you’ve got!”
On the other hand, without lensing we would not be able to study many of these objects at all, as Haojing Yan (Ohio State) notes:
“On one hand, lensing is good for us in that it enables us to detect galaxies that would otherwise be invisible; but on the other hand, we will need to correct our surveys to obtain accurate tallies… We predict that many galaxies in the most remote universe will only ever be visible to us because they are magnified in this way.”
Consequences for Future Work
This work began with images from the Hubble Ultra Deep Field survey, as Yan and colleagues sought to understand why so many of the distant galaxies in the survey seemed to be located near the line of sight to galaxies in the foreground. Statistical analysis has determined that strong gravitational lensing is the most likely explanation, and Yan’s current estimate is that as many as 20 percent of the most distant galaxies currently detected appear brighter than they actually are. But he notes that the 20 percent figure is a tentative one, adding:
“We want to make it clear that the size of the effect depends on a number of uncertain factors. If, for example, very distant galaxies are much fainter than their nearby counterparts but much more numerous, the majority of such distant galaxies that we will detect in the foreseeable future could be lensed ones.”
All of this means that future surveys will have to incorporate a gravitational lensing bias in high-redshift galaxy samples. Fortunately, the James Webb Space Telescope is on the way. With its high resolution and sensitivity at longer wavelengths, it should be able to separate out the lensing effect, untangling the images to allow further study, a task that is beyond the Hubble Wide Field Camera 3. And because surveys of the first galaxies are a major part of JWST’s mission, we have a classic case of the right instrument emerging at the right time.
We’re also going to need some interesting software upgrades. Windhorst notes the necessity of developing “…a next generation of object finding algorithms, since the current software is simply not designed to find these rare background objects behind such dense foregrounds. It’s like finding a few ‘nano-needles’ in the mother-of-all-haystacks.” Such work has obvious implications for any future space mission to exploit the Sun’s gravitational lens.
The paper is Wyithe et al., “A distortion of very-high-redshift galaxy number counts by gravitational lensing,” Nature 469 (13 January 2011), pp. 181-184 (abstract).
Follow with RSS or E-Mail
