Centauri Dreams
Imagining and Planning Interstellar Exploration
Can We Catch the Next ‘Oumuamua?
Ever since the passage of interstellar interloper ‘Oumuamua, we’ve become aware of the opportunities presented by objects entering our system from interstellar space, at the same time wishing we had the resources at hand to investigate them close-up. Andreas Hein and colleagues at the Initiative for Interstellar Studies have examined the possibilities for reaching ‘Oumuamua through Project Lyra (see Project Lyra: Sending a Spacecraft to 1I/’Oumuamua), a study that also takes in the kind of future infrastructure that could allow us to react to the next such object.
Now comes the interesting news that the European Space Agency is developing a mission called Comet Interceptor, one capable of visiting a long-period comet coming into the inner system from the Oort Cloud, but just as capable of reaching an interstellar visitor. The idea revolves around not a single spacecraft, but a combination of three. The composite vehicle would be capable of orbiting the L2 Lagrange point 1.5 million kilometers from Earth until it finds a suitable target. At that point, it would journey to the object and separate into three modules.
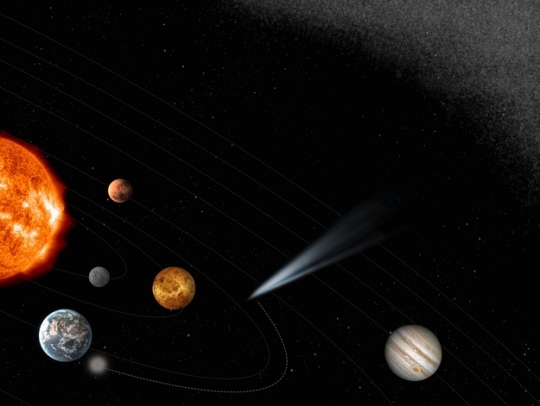
Image: Comet Interceptor has been selected as ESA’s new fast-class mission. It will be the first spacecraft to visit a truly pristine comet or other interstellar object that is only just starting its journey into the inner Solar System. The spacecraft will wait at the Sun-Earth Lagrange point L2, which is 1.5 million kilometres ‘behind’ Earth as viewed from the Sun. It will travel to an as-yet undiscovered comet, making a flyby of the chosen target when it is on the approach to Earth’s orbit. The mission comprises three spacecraft that will perform simultaneous observations from multiple points around the comet. Credit: ESA.
Each module will be equipped with a science payload that complements the instrumentation on the others, offering insights into cometary gas and dust and the plasma environment near the object through a mass spectrometer along with dust, field and plasma instruments. Thus we get ‘multi-point’ measurements offering insights into cometary interactions with the solar wind, the stream of plasma from the Sun that itself is constantly changing in velocity and intensity.
This is a fundamentally different concept from previous missions like Giotto and Rosetta. Giotto flew within 600 kilometers of Comet 1P/Halley in 1986, with another pass by Comet Grigg-Skjellerup in 1992. Rosetta targeted Comet 67P/Churyumov-Gerasimenko in a highly successful mission in 2014. Both comets are short-period objects with periods of less than 200 years, with 67P/Churyumov-Gerasimenko orbiting every 6.5 years and Halley every 76.
In both cases, the comet’s frequent passage into the inner system has meant changes to the surface. What Comet Interceptor is looking for is a first-time visitor, one whose materials should be relatively unprocessed since the earliest days of the system. But ESA is also thinking about interstellar objects like ‘Oumuamua as potential destinations, for the mission has the luxury of being able to choose its target from its stable vantage point at L2. Given the success of the Pan-STARRS effort at finding new comets and the construction of the Large Synoptic Survey Telescope in Chile, slated to reach first light in 2020, we should have no shortage of targets.
ESA director of science Günther Hasinger describes the mission in context:
“Pristine or dynamically new comets are entirely uncharted and make compelling targets for close-range spacecraft exploration to better understand the diversity and evolution of comets. The huge scientific achievements of Giotto and Rosetta – our legacy missions to comets – are unrivalled, but now it is time to build upon their successes and visit a pristine comet, or be ready for the next ‘Oumuamua-like interstellar object.”
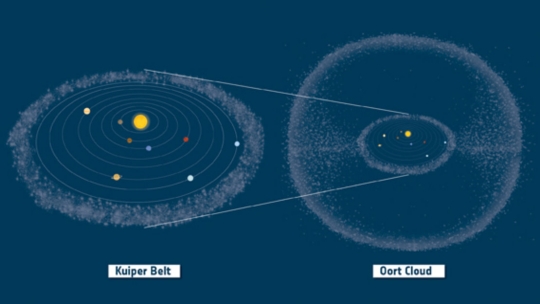
Image: Kuiper Belt and Oort Cloud in context. Credit: ESA.
In official terminology, Comet Interceptor is an F-class mission, the ‘F’ standing for ‘fast,’ as in ‘fast implementation’ — the total development time from selection of the mission to readiness to launch is to be eight years. But we might also consider it in terms of ‘fast response,’ just what is needed to reach objects that appear with no prior warning. This category of mission will have a launch mass of less than 1,000 kilograms. Comet Interceptor is now seen going into space along with exoplanet hunter ARIEL in 2028, both missions being delivered to L2.

Breakthrough Listen: SETI Data Release
On Monday I was talking about the rise of open access scientific journals, using the European Space Agency’s Acta Futura as just one example. The phenomenal arXiv service, not itself a journal but a repository for preprints of upcoming papers, is already well known in these pages. Now we have the largest public release of SETI data in the history of the field, a heartening follow-through on a trend that broadens the audience for scientific research.
Breakthrough Listen is presenting two publications in the scientific literature (available as full text, citation below) describing the results of three years of radio and optical observations, along with the availability of a petabyte of data from its work at the Green Bank instrument in West Virginia and the Parkes Radio Telescope in Australia. This covers a sample of 1327 nearby stars (within 160 light years from Earth) and builds on the team’s results on 692 stars as presented in 2017.
No signs of extraterrestrial civilizations turn up in the analysis, says Parkes project scientist Danny Price, who emphasizes that the search will continue:
“This data release is a tremendous milestone for the Breakthrough Listen team. We scoured thousands of hours of observations of nearby stars, across billions of frequency channels. We found no evidence of artificial signals from beyond Earth, but this doesn’t mean there isn’t intelligent life out there: we may just not have looked in the right place yet, or peered deep enough to detect faint signals.”
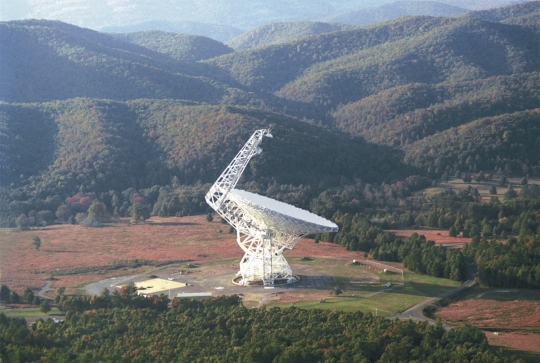
Image: The Green Bank site in West Virginia, where Breakthrough Listen observations continue. Credit: NRAO/AUI.
There are reasons why making such data public benefits the SETI effort. Both within the public and the astronomical community, those interested can now download the results of these observations and examine them independently. Those with programming skills may well develop algorithms for the detection of signals and filtering out of background noise that improve on the current model. And there may be information within the datasets that will prove useful in the investigation of unrelated astrophysical phenomena.
The existing tools developed by the Breakthrough Listen science team at the Berkeley SETI Research Center (BSRC) include both radio frequency searches as well as optical scans and algorithms designed to flag unexplained astrophysical phenomena. Go to this UC-Berkeley page for the overview, including the two just released papers. Likewise available to the public are software tools used in the analysis such as blimpy (for loading raw format data files), and turboSETI (for running Doppler drift searches). The datasets are examined in the analysis paper by Dr. Price and made available at the Breakthrough Listen Open Data Archive and via BSRC (more search options available at the latter).
For those wanting to get into data crunching themselves, the second paper (lead author Matt Lebofsky at Berkeley) goes into the intricacies of the current analysis, the tools used, the data formats and the archival systems now in play. “While we have been making smaller subsets of data public before in varying forms and contexts,” says Lebofsky, “we are excited and proud to offer this first cohesive collection along with an instruction manual, so everybody can dig in and help us search. And we’re just getting started – there’s much more to come!”
Considering the complexities involved in creating a search ‘pipeline’ that can scan through billions of radio channels, the more eyes on search algorithms and filtering techniques, the better. Thus far the detected signals have come from human technologies, with the Breakthrough Listen team filtering for narrow-band signals showing a Doppler drift, meaning they change in frequency with time because of their motion with respect to the telescope.
A second filter in the pipeline removes signals that do not appear to originate from a fixed point on the sky. The application of both techniques reduces millions of signals down to a comparative few, all of which have been examined and found to be human-generated frequency interference. From the Price paper, which notes that in its search for narrowband signals showing Doppler drift, 51 million hits emerged, with 6154 that cleared the automated filtering process, leading to a final round of manual inspection and cross-referencing against known sources of interference:
…these observations constitute the most comprehensive survey for radio evidence of advanced life around nearby stars ever undertaken, improving on the results of Enriquez et al. (2017) in both sensitivity and number of stars. Together with other recent work from the resurgent SETI community, we are beginning to put rigorous and clearly defined limits on the behavior of advanced life in the universe. We note that significant additional observational and theoretical work remains to be done before we are able to make general statements about the prevalence of technologically capable species.
Be aware that the archive also includes data from Breakthrough Listen observations of the first repeating fast radio burst ever detected, FRB 121102, as well as scans of the ‘Oumuamua object, along with optical data from the Automated Planet Finder at Lick Observatory. The search of nearby stars continues while also being expanded into the galactic disk at Parkes, and a one-million star sample with the MeerKAT telescope in South Africa is forthcoming.
The papers are Price et al., “The Breakthrough Listen Search for Intelligent Life: Observations of 1327 Nearby Stars over 1.1-3.4 GHz,” submitted to The Astrophysical Journal (preprint) and Lebofsky et al., “The Breakthrough Listen Search for Intelligent Life: Public Data, Formats, Reduction and Archiving,” submitted to Publications of the Astronomical Society of the Pacific (preprint).
CARMENES: Two Habitable Zone Planets around a Nearby Red Dwarf
We rarely talk about Teegarden’s Star when mentioning interesting objects near the Solar System, probably because the star was only discovered in 2003 and until now had not been known to host planets. Today we learn, however, that an international team led by the University of Göttingen has found two planets close to Earth mass in what it considers to be the habitable zone around the tiny star. Interestingly, from where the system is located, any local astronomers would be able to see the planets of our Solar System in transit across the face of the Sun, about which more in a moment.
One of the reasons that this comparatively nearby star has been so late to be discovered is its size. We are dealing with an M-class red dwarf, this one in the constellation Aries, and no more than 12.5 light years from us. It took three years of patient radial velocity monitoring to track down planets around a star that is only about 2700 degrees Celsius in temperature, and fully 10 times lighter than the Sun. What we now have are two planet candidates, each with a minimum mass 1.1 times that of Earth, with orbital periods of 4.91 and 11.4 days respectively.
These are, according to the paper, “…the first Earth-mass planets around an ultra-cool dwarf for which the masses have been determined using radial velocities.”
Because no transits have been detected, the scientists have no information on planetary radii, and therefore estimated them based on various possible compositions, from rocky to gaseous mini-Neptune, finding that the resulting radii differ by a factor of about three. The other stellar and planetary parameters were plugged into the Earth Similarity Index (ESI), which compares key parameters to those of Earth. If these worlds are not mini-Neptunes, we get this (from the paper):
Except for the case of a mini-Neptune composition, the two planets have a high ESI. For a potentially rocky composition, the ESI value is 0.94 and 0.8 for planets b and c, respectively. This makes Teegarden’s Star b the planet with currently the highest ESI value. However, the ESI is only an estimate, and different weighting of the parameters may lead to changing ESIs. This ESI definition, for example, does not take into account the stellar spectral energy distribution and the resulting planetary atmospheric composition, which very likely have an effect on habitability.
So we push at the boundaries of what we still don’t know. Lead author Matthias Zechmeister (University of Göttingen) noted the resemblance between these two worlds and the inner planets of our Solar System, saying “They are only slightly heavier than Earth and are located in the so-called habitable zone, where water can be present in liquid form.” I asked Dr. Zechmeister to amplify on the habitability zone finding, to which he replied:
You may have noted that PHL (http://phl.upr.edu/press-releases/pr_draft_tee4321) ranks Teegarden b now as the exoplanet most similar to Earth. The conditions are good for liquid water on the surface, given a similar insolation and mass as Earth’s. Still, we cannot be sure to 100%. We have measured “only” the mass (which is a minimum mass, but true masses are statistically only ~16% higher). So we do not know the true chemical composition, though a rocky composition is probable (see Fig. 12 in the paper for other compositions).
Dr. Zechmeister also made note of the fact that Teegarden’s Star is about 8 billion years old, roughly twice the age of the Sun, allowing plenty of time for interesting things to develop if life ever took hold there. And he raised a caution re the habitability issue, noting that the diminutive star is what he refers to as ‘an extreme host,’ a type of star about which we still have a great deal to learn.
So small is Teegarden’s Star that it is not far above the upper size limit for brown dwarfs, often considered to be somewhere between 60 and 90 Jupiter masses, and at magnitude 15, it demands a large telescope to see it at all. In fact, it was actually discovered in 2003 via stored data in the Near-Earth Asteroid Tracking (NEAT) program, and had been logged in our data earlier, turning up on photographic plates from the Palomar Sky Survey taken in 1951.
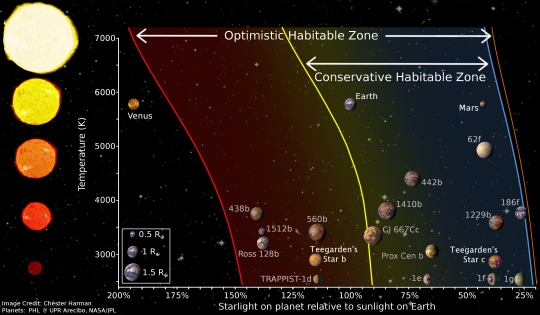
Image: Comparison habitable zone in Teff [effective temperaeture] – HZ diagram. Credit: C. Harman.
Now ponder this: Radial velocity detections have produced more than 800 exoplanets, but few have been found around old, cool M-dwarfs. In fact, we have only two other planet hosts with effective temperatures cooler than 3,000 K, and one of these is Proxima Centauri, while the other is TRAPPIST-1, around which fully seven transiting planets are known to exist. The authors of the paper on the Teegarden’s Star work consider the lack of planet detections around very late-type stars the result of observational bias owing to the faintness of the objects at visible wavelengths.
From the paper:
Both planets have a minimum mass close to one Earth mass, and given a rocky, partially iron, or water composition, they are expected to have Earth-like radii. Additionally, they are close to or within the conservative HZ, or in other words, they are potentially habitable. Our age estimate of 8 Gyr implies that these planets are about twice as old as the solar system. Interestingly, our solar system currently is within the transit zone as seen from Teegarden’s Star. For any potential Teegardians, the Earth will be observable as a transiting planet from 2044 until 2496.
A later note from co-author Guillem Anglada-Escudé, the discoverer of Proxima Centauri b, unpacks this further. The transit that would be visible from this system in 2044 would have occurred in our Solar System in 2032, factoring in the 12 year light travel time. There have been SETI discussions regarding the possibility of conducting communication attempts of stars whose planets would see our own world in transit around the Sun, so any such attempt would need to take place in 2032 or later, with the earliest potential response expected around 2056.
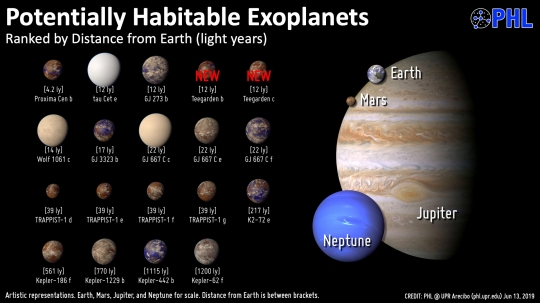
Image: Top 19 potentially habitable exoplanets, sorted by distance from Earth. Credit: A. Mendez (PHL).
The team behind this work used data from CARMENES (Calar Alto high-Resolution search for M dwarfs with Exoearths with Near-infrared and optical Échelle Spectrographs), an effort using two separate spectrographs located at the 3.5m telescope at the Calar Alto Observatory in Almeria, Spain. The goal of the project, conducted by a consortium of German and Spanish institutions, is to carry out a survey of approximately 300 late-type main-sequence stars with the goal of detecting low-mass planets in their habitable zones.
We have not, in other words, heard the last from CARMENES.
The paper is Zechmeister et al. “The CARMENES search for exoplanets around M dwarfs – Two temperate Earth-mass planet candidates around Teegarden’s Star,” accepted at Astronomy & Astrophysics 2019 (abstract).
ESA Advanced Concepts Team Interstellar Workshop
Given the difficulties that persist in retrieving many good papers from behind publisher firewalls, I’m always glad to see open access journals plying their trade. Let me call your attention in particular to Acta Futura, which comes out of the scientists working with the European Space Agency’s Advanced Concepts Team. Acta Future defines itself as multidisciplinary in scope with a focus on the long-term development of space science.
Hence the list of topics is wide, as the website notes, “…ranging from fundamental physics to biomimetics, mission analysis, computational intelligence, neuroscience, as well as artificial intelligence or energy systems,” and this does not exhaust the range of possibilities. If you’re interested in browsing through or searching the archives, click here for a page with the appropriate links as well as information on how to submit papers to Acta Futura.
I’ve had ESA’s Advanced Concepts Team on my mind this weekend because long-time Centauri Dreams reader David Wojciech passed along news of the upcoming ACT interstellar workshop, beginning this week on the 20th, and carrying over to the following day. The conference anticipates an upcoming issue of Acta Futura devoted to interstellar exploration. The venue will be Erasmus Highbay at ESTEC, Noordwijk, Netherlands.
Topics to be covered in depth are:
- Advanced propulsion technologies for interstellar probes
- Communication for interstellar exploration
- Concepts and ideas surrounding world ships: sociology, ethics, anthropology, language development
- Technologies and measure to keep humans alive, healthy and productive during long duration spaceflight
And I note that registration is free of charge until June 18, so if you’re fortunate enough to be in range of the meeting, be sure to check in at the conference webpage. I’m seeing plenty of good material here, from Pontus Brandt’s “A Pragmatic Interstellar Probe in the 2030s,” to Andreas Hein’s “World ships: feasibility and rationale” and Michael Hippke’s “Interstellar communication.” But look at the whole list (available here), which includes Philip Lubin on laser propulsion, Rob Swinney on fusion, Angelo Vermeulen on evolvable spacecraft and Ugo Lafont on self-healing materials. Most of these will be familiar names to regular Centauri Dreams readers.
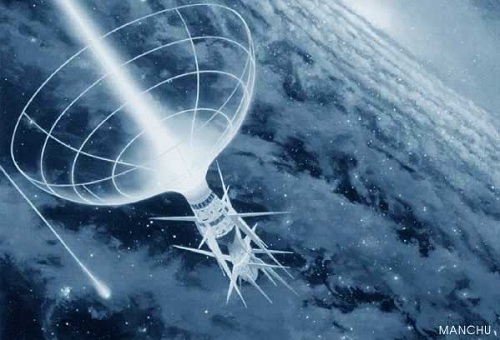
Image: A Bussard ramjet in flight, as imagined for ESA’s Innovative Technologies from Science Fiction project. Credit: ESA/Manchu.
There was a time not so long ago when posting news of an upcoming interstellar conference would be relevant only to those within immediate geographic range. The entire field of interstellar studies, in fact, was once an afterthought at conferences largely devoted to other matters, usually discussed only at the end. These days, a rising interest in interstellar possibilities leads to conferences whose papers will be readily accessible in an open access journal like Acta Futura. We’ll have a look at these when the materials reach publication stage.
Giant Planets Less Likely around Sun-like Stars
We’re getting first results from the Gemini Planet Imager Exoplanet Survey (GPIES), a four-year look at 531 young, nearby stars that relies on the instrument’s capabilities at direct imaging. Data from the first 300 stars have been published in The Astronomical Journal, representing the most sensitive, and certainly the largest direct imaging survey for giant planets yet attempted. The results of the statistical analysis are telling: They suggest that planets slightly more massive than Jupiter in outer orbits around stars the size of the Sun are rare.
The Gemini Planet Imager (GPI), located at the Gemini South Telescope in Chile, can achieve high contrast at small angular separations, making it possible to see exoplanets directly, as opposed to the indirect methods that have dominated the field, such as transits and radial velocity analysis. As successful as the latter have been, they are most effective with planets closer to their stars, whereas an instrument like the GPI can find planets in regions outside the orbit of Jupiter. The GPI can directly image exoplanets a millionth as bright as the host star.
Bruce Macintosh (Stanford University), principal investigator for the GPI, calls this effort “…the most sensitive direct imaging survey for giant planets published to date.” The question it raises is significant: Just how representative is our Solar System in having gas giants like Jupiter and Saturn in outer orbits around a G-class star? We’re only beginning to learn the answer, but surveys like this one are on track to tell us. The answer may have astrobiological consequences, as Franck Marchis (SETI Institute), a co-author of the just published report, explains:
“We suspect that in our solar system Jupiter and Saturn sculpted the final architecture that influences the properties of terrestrial planets such as Mars and Earth, including basic elements for life such as the delivery of water, and the impact rates. A planetary system with only terrestrial planets and no giant planets will probably be very different to ours, and this could have consequences on the possibility for the existence of life elsewhere in our galaxy.”
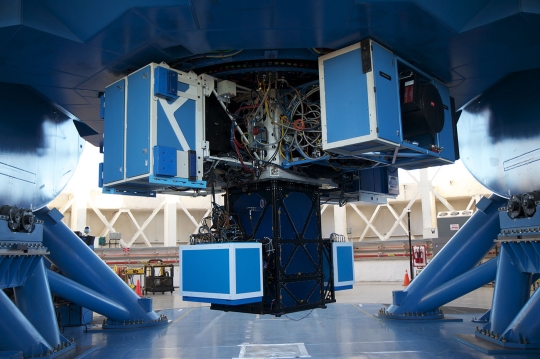
Image: Close-up Picture of Gemini Planet Imager currently located at Gemini South Observatory in Cerro Pachon. Photo by J. Chilcote.
Out of the 300 stars in the thus far released Gemini survey data, 123 are more than one-and-a-half times more massive than the Sun. What the data show is that the hosts of the planets thus far detected are all among the higher mass stars. This despite the fact that given the differential between stellar light and that of a planet, a giant planet orbiting a fainter star more like the Sun is actually easier to see. This relationship of mass to giant planet frequency has been discussed in the literature and is now strengthened by the results of the GPI survey.
The results of the Gemini survey pick up on the theme that other planetary systems tend to be different from our own, despite the assumption that gas giants in outer orbits and rocky worlds on inner orbits would be a fairly standard pattern. Both the GPIES and other exoplanet surveys point to the rarity of giant planets around stars as small as the Sun. Worlds several times more massive than Jupiter and above (the GPIES is not sensitive enough to pick up planets of as low a mass as Jupiter itself) tend to be hosted by stars more massive than the Sun. Our own wide-orbit Jupiter, then, may be a statistical outlier, although that is yet to be determined.
From the paper’s conclusion:
From the first 300 stars observed out of the planned 600-star survey, reaching contrasts of 106 within 1?? radius, GPIES is one of the largest and deepest direct imaging surveys for exoplanets conducted to date. Our analysis of the data shows that there is a clear stellar mass dependence on planet occurrence rate, with stars >1.5 M? [i.e. 1.5 times Solar mass] more likely to host giant planets (5–13 MJup ) at wide separations (semimajor axes 10–100 au) than lower-mass stars.
The paper reports the imaging of six planets and three brown dwarfs, with a sensitivity to planets of several Jupiter masses at orbital distances comparable to those beyond Saturn (at least 12 gas giants had been expected based on earlier models). The only previously unknown planet was 51 Eridani b, which was discovered via GPI as far back as 2014, a gas giant of two-and-a-half Jupiter masses in a Saturn-like orbit around a young star some 97 light years away, and one that had been previously unknown despite attempts to observe the star because no other instrument was able to sufficiently suppress the starlight to make the planet visible.
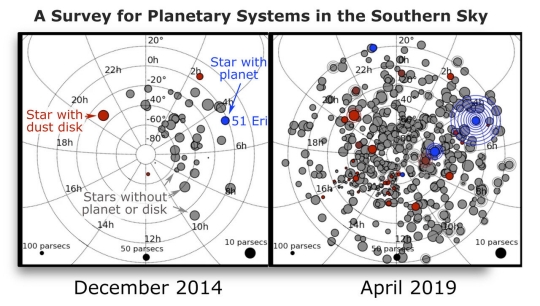
Image: Results of the survey of 531 stars and their exoplanets in the southern sky are plotted to indicate their distance from Earth. Gray dots are stars without exoplanets or a dust disk; red are stars with a dust disk but no planets; blue stars have planets. Dots with rings indicated stars imaged multiple times. Credit: Paul Kalas, UC Berkeley; Dmitry Savransky, Cornell; Robert De Rosa, Stanford.
Another useful find: A brown dwarf labeled HR 2562 B, 30 times more massive than Jupiter in a Uranus-like orbit. This brown dwarf and the other two imaged in the study shed light on planet vs. brown dwarf formation at wide separations from the host star. The question of brown dwarf vs. planet formation is long-standing. Whereas stars have been considered to form through the gravitational collapse of large clouds of gas and dust, planets are thought to have formed largely through core accretion, as small rocky bodies undergo collision and accumulation of mass.
Eugene Chiang (UC-Berkeley) is a co-author of the paper:
“What the GPIES Team’s analysis shows is that the properties of brown dwarfs and giant planets run completely counter to each other. Whereas more massive brown dwarfs outnumber less massive brown dwarfs, for giant planets, the trend is reversed: less massive planets outnumber more massive ones. Moreover, brown dwarfs tend to be found far from their host stars, while giant planets concentrate closer in. These opposing trends point to brown dwarfs forming top-down, and giant planets forming bottom-up.”
So our Solar System evidently doesn’t resemble many other systems that we’ve observed. Gas giants in outer orbits seem to be more common around significantly larger stars. Putting together a catalog of gas giants in the outer systems of other neighboring stars is going to take time — it’s telling that even the GPI can’t detect Jupiter-mass planets in these orbits — but the GPIES is the beginning of that process, and one that will soon publish additional results. Observations in the survey wrapped up in January with an examination of its 531st star. Moving toward their report on the complete dataset, the team is now following up candidate planets at the same time that it begins an upgrade on the Gemini Planet Imager itself.
The paper is Nielsen et al., ”The Gemini Planet Imager Exoplanet Survey: Giant Planet and Brown Dwarf Demographics from 10 to 100 au,” Astronomical Journal Vol. 158, No. 1 (12 June 2019). Abstract.
What Sodium Chloride Means for Europa’s Ocean
We have priceless data on Europa from the Voyager and Galileo missions, but we’re updating earlier interpretations thanks to new work with both the Hubble Space Telescope and the Keck Observatory on Mauna Kea (Hawaii). Thus the discovery that the yellow color visible on parts of Europa’s surface in visible light is most likely sodium chloride (NaCl), familiar as table salt and the principal component of sea salt. That’s an interesting result, given that it suggests a Europan ocean chemically more similar to Earth’s than we had previously assumed.
The re-thinking of the spacecraft data stems from the fact that Galileo was equipped with the Near-Infrared Mapping Spectrometer instrument, useful for analyzing the surface of a planetary body. What Galileo lacked, however, was a visible spectrometer to complement its near-infrared device. The problem: Chlorides are not apparent in the near-infrared. While Galileo had found water ice, it identified a substance believed to be magnesium sulfate salts on the surface.
But spectral data from the Keck instrument showed none of the expected sulfate absorptions. Caltech graduate student Samantha Trumbo is lead author of the paper on this work:
“No one has taken visible-wavelength spectra of Europa before that had this sort of spatial and spectral resolution. The Galileo spacecraft didn’t have a visible spectrometer. It just had a near-infrared spectrometer, and in the near-infrared, chlorides are featureless.”
The researchers used spectra obtained with the Hubble instrument to detect a 450-nm absorption indicating irradiated sodium chloride on the surface. Moreover, this feature correlates with the interesting ‘chaos’ terrain that seems to show interactions with the ocean below, making it appear that there is an interior source for the sodium chloride, as discussed in the paper’s conclusion:
As chaos terrain is geologically young, extensively disrupted, and potentially indicative of locations of subsurface upwelling or melt-through…, and as the leading hemisphere chaos regions are shielded from the sulfur implantation of the trailing hemisphere, the composition of these regions may best represent that of Europa’s endogenous material. However, their spectra are categorically smooth at higher spectral resolution, lacking any identifiable infrared spectral features other than those of water ice. Nevertheless, the unique geology and 1.5- to 4-μm spectra of leading hemisphere chaos terrain suggest a salty composition. Chloride salts provide a potential explanation…
At the Jet Propulsion Laboratory, co-author Kevin Hand put ocean salts to the test under conditions of radiation similar to Europa’s, finding that sodium chloride produced color changes under irradiation that could be identified through analysis of the visible spectrum. Hand likens the substance to invisible ink — radiation is what makes it apparent to the observer. In the laboratory, it turns a shade of yellow similar to the Europan region known as ‘Tara Regio.’ The 450-nm absorption in the visible spectrum detected by Hubble matches the irradiated salt in the laboratory, firming up the idea that Tara Regio’s color comes from irradiated NaCl.
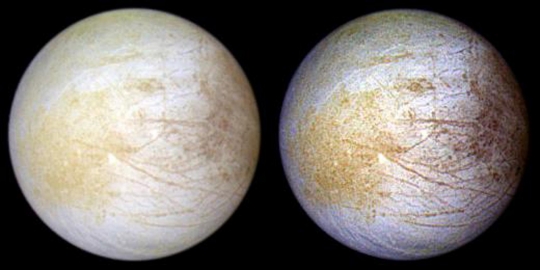
Image: This color composite view combines violet, green, and infrared images of Jupiter’s intriguing moon, Europa, for a view of the moon in natural color (left) and in enhanced color designed to bring out subtle color differences in the surface (right). The bright white and bluish part of Europa’s surface is composed mostly of water ice, with very few non-ice materials. In contrast, the brownish mottled regions on the right side of the image may be covered by hydrated salts and an unknown red component. The yellowish mottled terrain on the left side of the image is caused by some other unknown component. Long, dark lines are fractures in the crust, some of which are more than 3,000 kilometers long. Credit: NASA/JPL/University of Arizona.
We could be looking at sodium chloride as one of the various materials found in the moon’s outer shell, but the prospect that it is derived from the subsurface ocean means that we may have an insight here into the chemistry going on beneath the ice. From the paper:
The presence of NaCl on Europa has important implications for our understanding of the internal chemistry and its geochemical evolution through time. Whereas aqueous differentiation of chondritic material and long-term leaching from a chondritic seafloor can result in a system rich in sulfates, more extensive hydrothermal circulation, as on Earth, may lead to an NaCl-rich ocean. The plume chemistry of Enceladus, which is perhaps the best analog to Europa, suggests an NaCl-dominated ocean and a hydrothermally active seafloor. However, the compositional relationship between Europa’s ocean and its endogenous material is unknown, and the surface may simply represent the end result of a compositional stratification within the ice shell… Regardless of whether the observed NaCl directly relates to the ocean composition, its presence warrants a reevaluation of our understanding of the geochemistry of Europa.
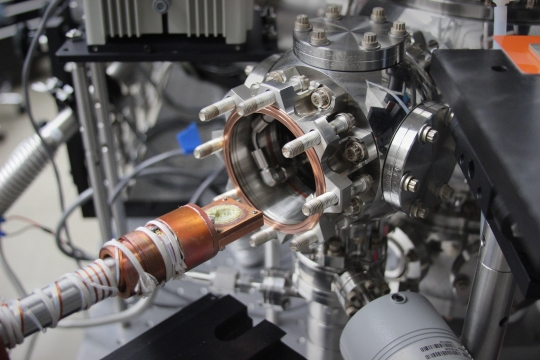
Image: In a laboratory simulating conditions on Jupiter’s moon Europa at NASA’s Jet Propulsion Laboratory in Pasadena, California, plain white table salt (sodium chloride) turned yellow (visible in a small well at the center of this photograph). The color is significant because scientists can now deduce that the yellow color previously observed on portions of the surface of Europa is actually sodium chloride. The JPL lab experiments matched temperature, pressure and electron radiation conditions at Europa’s surface. Credit: NASA/JPL-Caltech.
A more active seafloor than we have assumed? If so, Europan geology becomes still more interesting. A geologically young icy shell with striking areas showing past activity amid evidence of NaCl makes the assumption that these salts derived from the ocean plausible.
The paper is Trumbo et al., “Sodium chloride on the surface of Europa,” Science Advances Vol. 5, No. 6 (12 June 2019). Full text.
Follow with RSS or E-Mail
